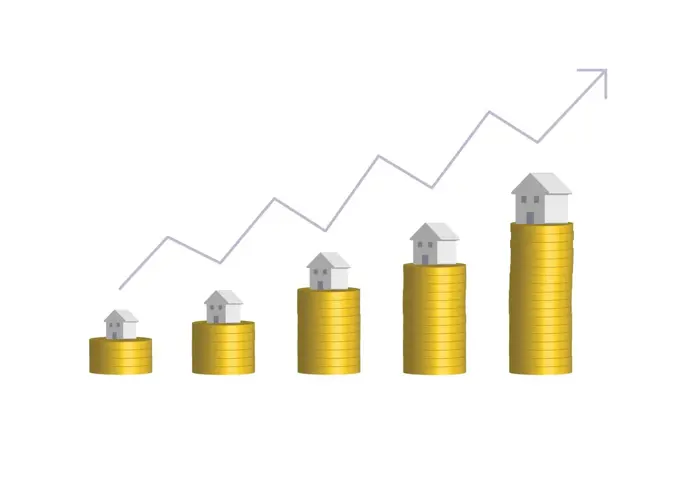
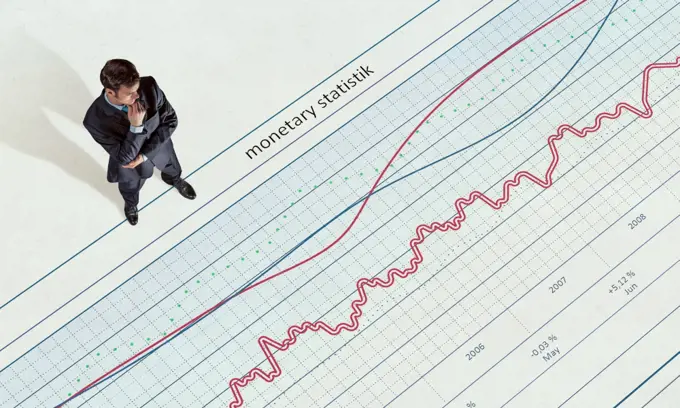
Business Growth VisualizationImages depicting graphs and charts illustrating business growth. Includes elements like arrows and hands emphasizing financial progress and strategies. How big progress is. Close up of hand measuring growing graph with ruler 362 assets in this story5507-422799251525-233260541525-235585321525-203658851525-229195751525-235903601525-235504761525-258647491525-249554181525-269081285507-465371771525-232370251525-562034561525-662569091525-274254471525-238024801525-265202481525-226250431525-214797581525-258642661525-231992631525-680311451525-210370991525-258661751525-259800196188-691162901525-238096121525-282224051525-235828961525-271056101525-204979841525-246920661525-265000841525-226142475507-413425735507-439060951525-238096101525-231742371525-564700145507-425199531525-239258941525-236845801525-236249405507-411089311525-265489891525-573999325507-456000811525-235985495507-315677901525R-1372351525-256917641525-258590451525-241274861525-663221441525-243348621525-214879634197-667139351525-561376101525-572613915507-321325931525-226248555507-420676721525-248489141525-239844961525-276728291525-199086361525-231856501525-225873381525-238533825507-443319121525-236028541525-570709581525-247038991525-235144791525-222374191570-672833361525-228037775507-457902981525-231855971525-235397281525-257074171525-223443351525R-1373711525-644572414128R-130486391525-231919081525-247279531525-237360061525-264416305507-405539524197-667139381525-569775751525-259485481525-213721786188-560624641525-228212911525R-1765921525-250180581525-231856001525-56199548 PREVIOUS of 4 NEXT