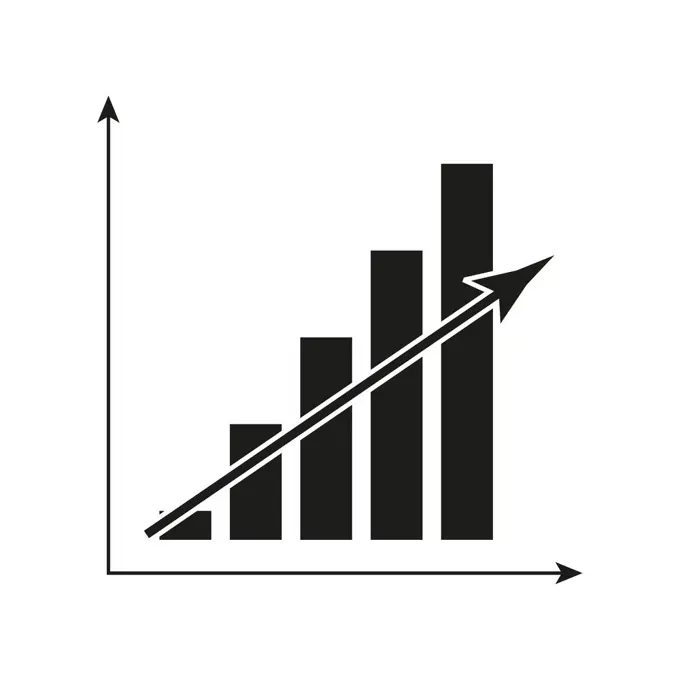
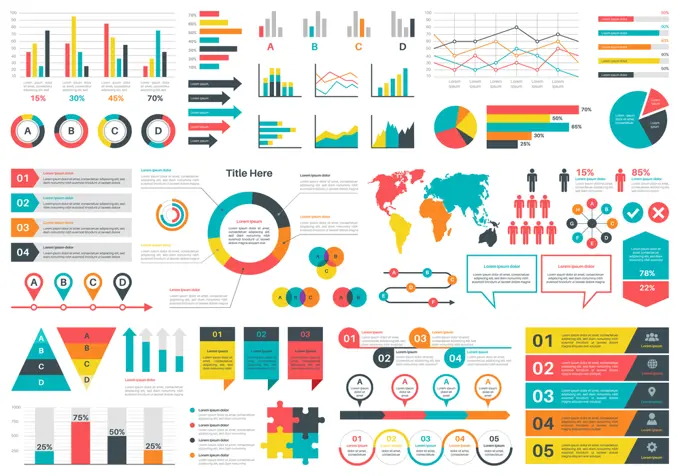
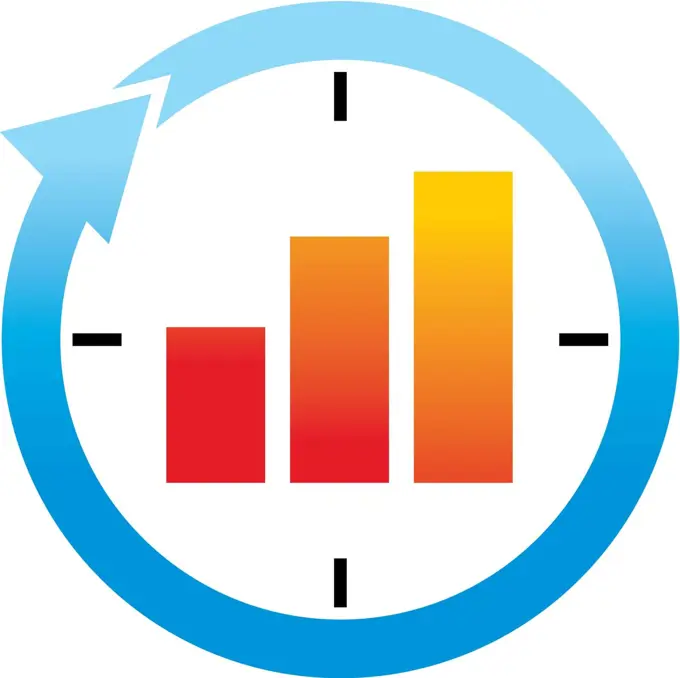
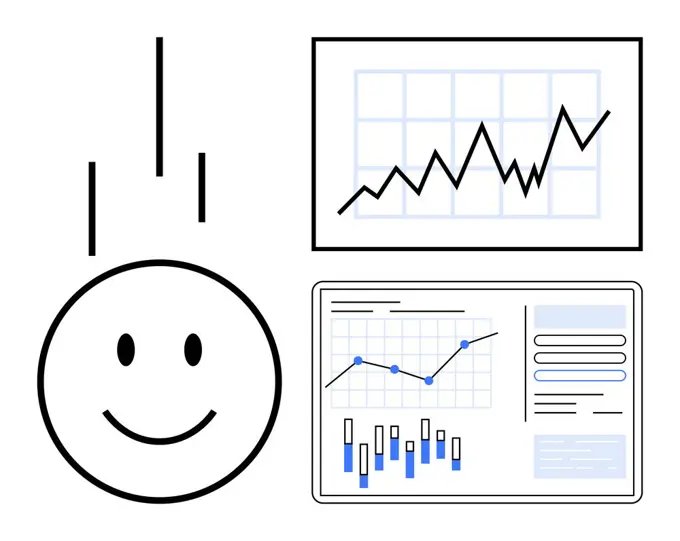
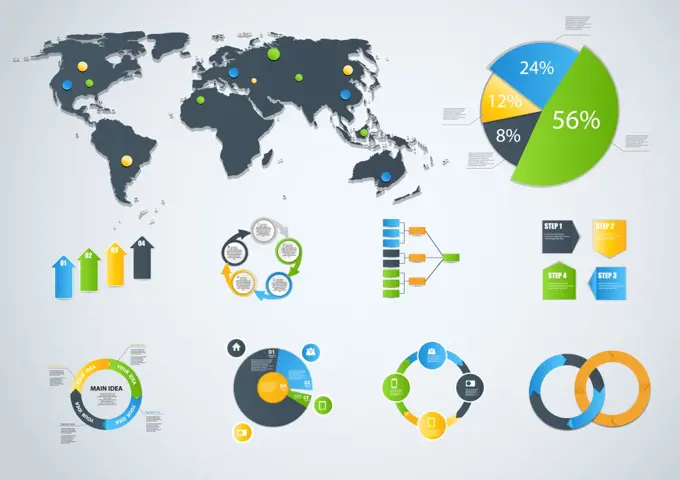
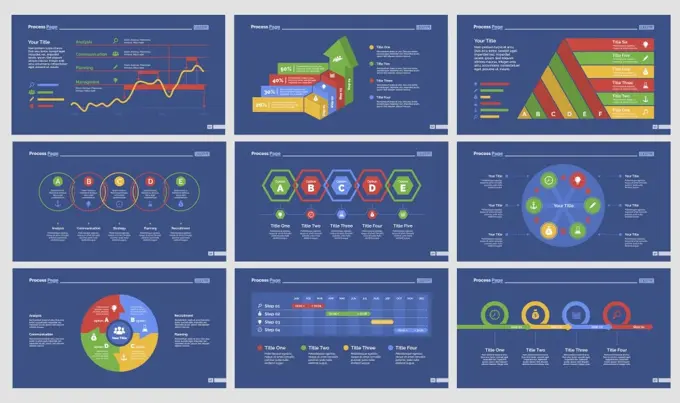
Data Analytics and Visualization
Colorful illustrations of bar and line graphs, checkmarks, and clipboards representing data analysis and performance metrics.

321 assets in this story
5507-39427523

1525-76160773

1525-24491198

1525-67469326

1525-75692360

1525-27009532

1525-24156730

1525-25758815

1525-20590305

1525-23938981

1525-22051299

5507-45790201

1525-27921967

1525-66329287

1525-56600182
1525-27559849

1525-75815351

1525-68028790

5507-42996545

1525-67553030

1525-27971645

1525-68030948

1525-28335871

1525-26791478

1525-28455146

1525-21959893

1525-65005187

1525-56536601

5507-51260089

1525-27131082

1525-26787983

1525-28251682

1525-24540009
5507-51259999
5507-47645282

1525-27873668

1525-56949506

1525-24556356

1525-56999318

5507-48190271

5507-42997395

1525-25721320

5507-47699898

1525-67242752

5507-42873817

1525-68218553

1525-57421088

1525-67598909

1525-27833997

1525-66385053

1525-27374833

1525-26291154

5507-46014164

1525-67531827

1525-56778499

5507-43881972

1525-26437116

1525-68161497

5507-42873815

5507-44340610

5507-40161210

1525-57249925

1525-56778534

1525-68030698
1525-21945605
1525-24572122

1525-66432671

1525-57261007

5507-38100058

5507-40977633

1525-75969815

1525-57168791

1525-24756508
1525-56536602

1525-75816116

5507-42868984

1525-27425887

1525-26757314
5507-31718685

1525-26196225

1525-68160936

1525-56925035

1525-27664295

1525-72901950

1525-56259051

1525-26757736

1525-26870794

5507-41828831

5507-30637464

1525-22680568

1525-67553351
5507-31681248

1525-57373172

1525-23711555

5507-30580168

1525-24727351

1525-28227353

1525-27788128

1525-68029567

5507-46013759
