My Boards
View Pictures
  • My Boards

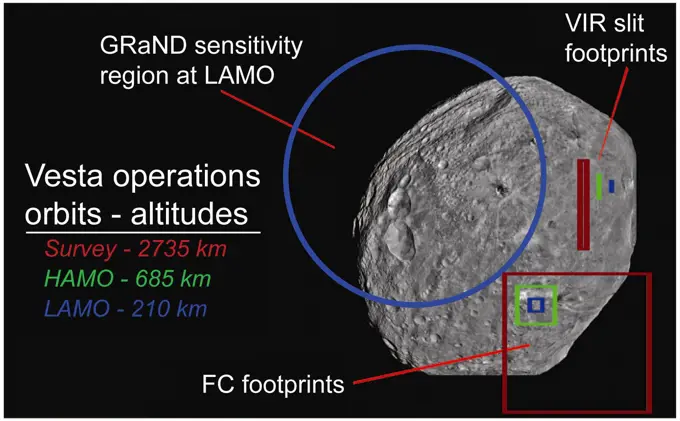
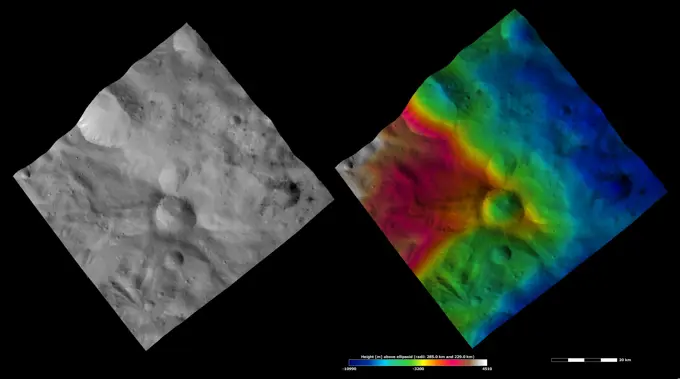
Asteroid Vesta Imagery

Diverse images from NASA's Dawn spacecraft showcasing the terrain and surface details of asteroid Vesta, including color variations and geological features.

These images from NASA's Dawn spacecraft are located in asteroid Vesta's Sextilia quadrangle, in Vesta's southern hemisphere.
143 assets in this story
6145-44502447
This anaglyph, from NASA's Shuttle Radar Topography Mission, is of Pasadena, California, looking north toward the San Gabriel Mountains. 3D glasses are necessary to view this image.
6145-44616285
'Columbia Hills' from Orbit
6145-44531270
In August 2001, NASA's Galileo spacecraft has returned imagery of a hot spot on Jupiter's moon Io that was the source of a towering plume indicating a sulfur-dioxide concentration that may have been fallout from the plume.
6145-44943366
This false-color map shows the area within Gale Crater on Mars, where NASA's Curiosity rover landed on Aug. 5, 2012 PDT (Aug. 6, 2012 EDT) and the location where Curiosity collected its first drilled sample at the 'John Klein' rock.
6145-44768598
This image shows the location of Cassini's most precise measurements so far of the surface temperatures at the active tiger
6145-44953122
This set of images shows what might be hardware from the Soviet Union's 1971 Mars 3 lander, seen in a pair of images from the High Resolution Imaging Science Experiment (HiRISE) camera on NASA's Mars Reconnaissance Orbiter.
6145-45026097
Color coding in this image of Mars represents differences in elevation, measured by NASA's Mars Global Surveyor. While surface liquid water is rare and ephermal on modern Mars.
6145-45026093
NASA's Mars Exploration Rover Opportunity studied layers in the Burns Cliff slope of Endurance Crater in 2004. The layers show different types of deposition of sulfate-rich sediments. Opportunity's panoramic camera recorded this image.
6145-44717233
Clay Minerals in Mawrth Vallis Region of Mars
6145-45299045
These 26 holes represent each of the rock samples NASA's Curiosity Mars rover has collected as of early July 2020. A map in the upper left shows where the holes were drilled along the rover's route, along with where it scooped six samples of soil.
6145-45042003
This animation depicts a time-series of ground deformation at Mount Etna Volcano between 1992 and 2001. The deformation results from changes in the volume of a shallow chamber centered approximately 5 km (3 miles) below sea level.
6145-45123738
This graphic maps locations of the sites where NASA's Curiosity collected its first 19 rock or soil samples for analysis by laboratory instruments inside the vehicle. It also presents images of the drilled holes where 15 rock-powder samples were acquired.
6145-45072227
This is a map of lower Mount Sharp on Mars, showing the major geologic units identified from orbit. The rocks of the 'Murray Formation,' mapped in green, likely represent the oldest layers of Mount Sharp that NASA's Curiosity rover will explore.
6145-45000774
Rock targets known as 'Esperance6,' and 'Lihir,' are shown in this false-color view from NASA's Mars Exploration Rover Opportunity. Esperance6 was deeply abraded with the rover's rock abrasion tool.
6145-44635890
Five Years of Monitoring Mars' Daytime Surface Temperatures (Animation)
6145-45062525
This map shows in red the route driven by NASA's Curiosity Mars rover from the 'Bradbury Landing' location where it landed in August 2012 to nearly the completion of its first Martian year. The white line shows the planned route ahead.
6145-45071151
A magnitude 6.0 earthquake struck southern Napa county northeast of San Francisco, California, on Aug. 24, 2014. NASA satellite data reveal ground defomation.
6145-44736430
Pioneer Complete Venus Map
6145-45092035
The March, 2015 eruption of Turrialba Volcano in Costa Rica caught everyone by surprise as seen in this image from the ASTER instrument onboard NASA's Terra spacecraft.
6145-45068479
One a Penny, Two a Penny, Bright, Fresh Crater
6145-44899556
This global map of Mars was acquired on Oct. 28, 2008, by the Mars Color Imager instrument on NASA's MRO. One global map is generated each day to forecast weather conditions for the entry, descent and landing of NASA's Curiosity rover.
6145-44554961
Region of Pathfinder Landing Site
6145-45029117
A section of NASA's Mars Science Laboratory's Gale Crater landing site is shown, with a representative path from the landing location toward the layered mound to the south.
6145-44914029
NASA's Terra spacecraft captured this imagery and data over Hurricane Sandy as the storm approached the U.S. east coast on Oct. 28, 2012. The image at left covers an area 250 miles (400 kilometers) wide and extends from Massachusetts to Florida.
6145-44707605
Trench Visualization
6145-44635611
Cassini's Sept. 7, 2005, Titan Flyby
6145-44608306
Found You!
6145-44841831
This map shows the path that NASA's Mars Exploration Rover Opportunity followed from the 1,813th Martian day, or sol, to Sol 2450 (Dec. 15, 2010) when Opportunity approached a crater informally named 'Santa Maria.'
6145-45266654
The Advanced Rapid Imaging and Analysis (ARIA) team at NASA's Jet Propulsion Laboratory in Pasadena, California, created this map of the Ridgecrest area of Southern California following two strong earthquakes  a magnitude 6.4 on July 4 and a magnitude 7.1 on July 5, 2019. The map shows how much and in what direction the ground moved in various places, displayed in meters. The blue tones show that the ground west of the main fault rupture, which runs from the lower right to the upper left, moved toward the northwest by as much as 0.8 meters (2.7 feet) during the 7.1-magnitude quake. The ground in the red and pink areas moved southeast by as much as 0.6 meters (2 feet). Black lines show faults that were mapped before the 2019 earthquakes. The 6.4-magnitude quake moved a shorter fault that runs perpendicular to the main fault  shown slightly down and to the left of center on the map. The colors in this area show that the north side of the fault moved to the west (blue) and the south sid
6145-44665760
This graphic from NASA's Dawn shows fields of view of Dawn instruments from Survey orbit (red), High Altitude Mapping Orbit (green), and Low Altitude Mapping Orbit (blue). This image is part of the Mission Art series from NASA's Dawn mission.
6145-44881276
New MESSENGER Results at LPSC: Caloris Tectonic Map
6145-44745718
This map shows a color-coded interpretation of geomorphic units -- categories based on surface textures and contour -- in the region where NASA's Phoenix Mars Lander has studied an arctic Martian plain.
6145-44610179
Seeing Red at Guadalupe
6145-44784225
This composite graphic illustrates the use of the Shallow Radar instrument on NASA's Mars Reconnaissance Orbiter for mapping underground ice-rich layers of the north polar layered terrain on Mars.
6145-44706505
Fun, fairy-tale nicknames have been assigned to features in this animated view of the workspace reachable by the robotic arm of NASA's Phoenix Mars Lander. For example, 'Sleepy Hollow' denotes a trench and 'Headless' designates a rock.
6145-58966601
This star chart illustrates the large patch of sky that NASA's Kepler mission will stare at for the duration of its three-and-a-half-year lifetime.
6145-44964778
This map of a portion of the western rim of Endeavour Crater on Mars shows the path of NASA's Mars Exploration Rover Opportunity as the rover is driving from the 'Cape York' segment of the rim to its next destination, the 'Solander Point' segment.
6145-44634822
Cassini's Aug. 22, 2005, Titan Flyby
6145-44826277
This image shows a UAVSAR interferogram swath overlaid atop a Google Earth image. New NASA airborne radar images show the continuing deformation in Earth's surface resulting from the magnitude 7.2 temblor in Baja California on April 4, 2010.
6145-44945323
The Dynamic Albedo of Neutrons (DAN) instrument on NASA's Mars rover Curiosity detects even very small amounts of water in the ground beneath the rover, primarily water bound into the crystal structure of hydrated minerals.
6145-44575140
This image of Fort Irwin in California's Mojave Desert compares interferometric radar signatures topography - data that were obtained by multiple imaging of the same region to produce three-dimensional elevation maps.
6145-58967051
Gale Crater, the Selected Landing Site for Curiosity
6188-67444271
3D Isometric Flat Conceptual Illustration of Liquefaction, Liquified Soilbr3D Isometric Flat Conceptual Illustration of Liquefaction, Liquified Soil 3D Isometric Flat Conceptual Illustration of Liquefaction, Liquified Soil 3D Isometric Flat Conceptual Illustration of Liquefaction, Liquified Soil Copyright: xZoonar.com/AnastasiiaxTorianykx 22978962
PREVIOUS
of 2
NEXT
2401 S. Ervay, Suite 206
Dallas, Texas 75215
United States
Get Started
Free ResearchMy BoardsMy Cart
For Creators
How To License Your ContentContributor PortalFrame of Mind
Resources
API accessPricing
Contact
+1 866 236 0087help@viewpictures.co.uk Contact form
©2026 View Pictures. All Rights Reserved. -A
This site is protected by reCAPTCHA and Google Privacy Policy and Terms of Service apply.