Business Analytics and Reports
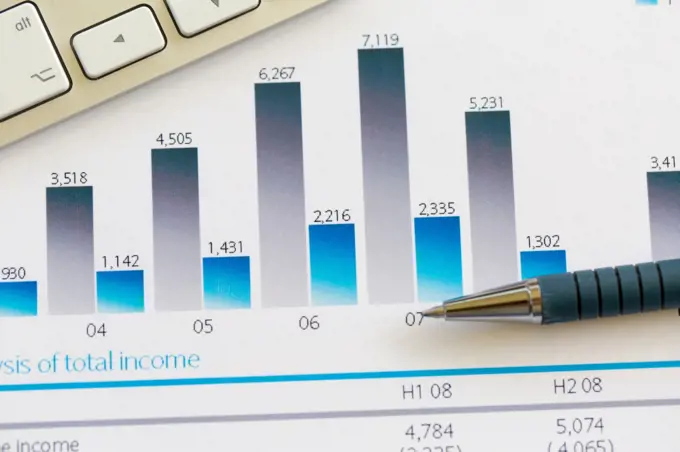
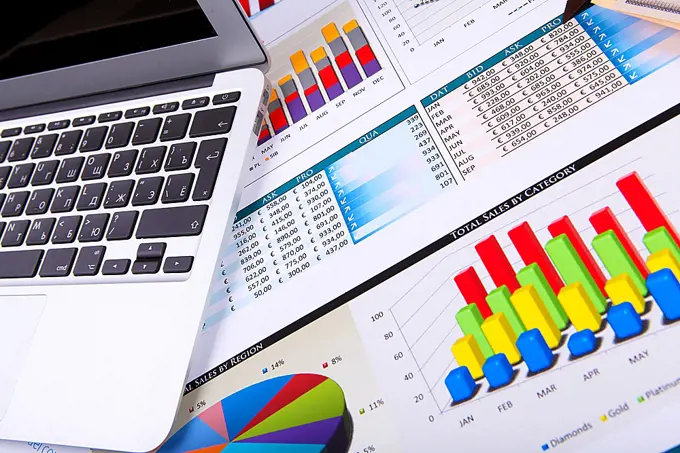
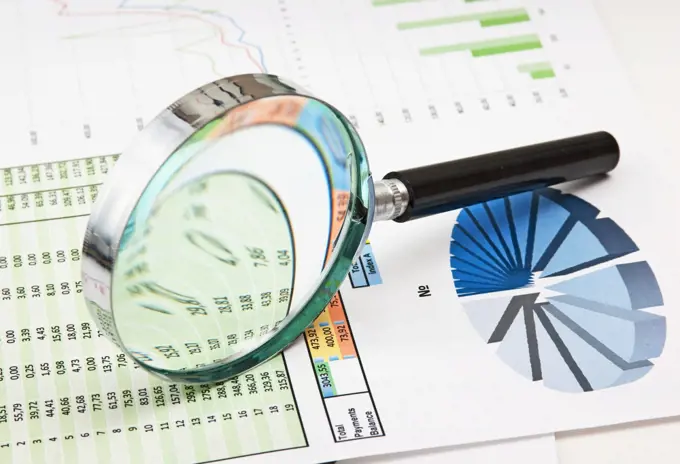
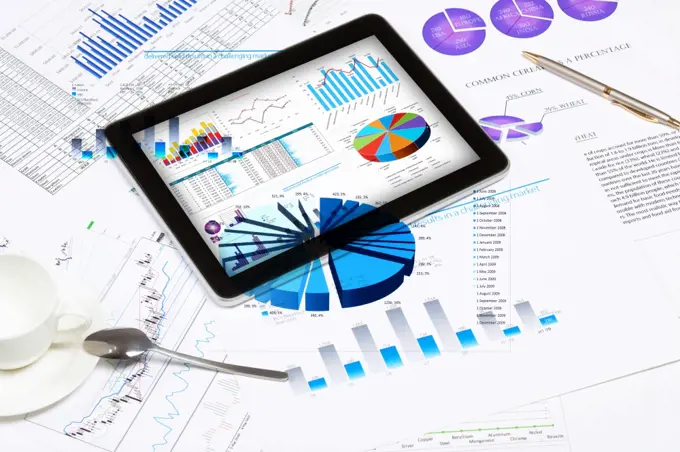
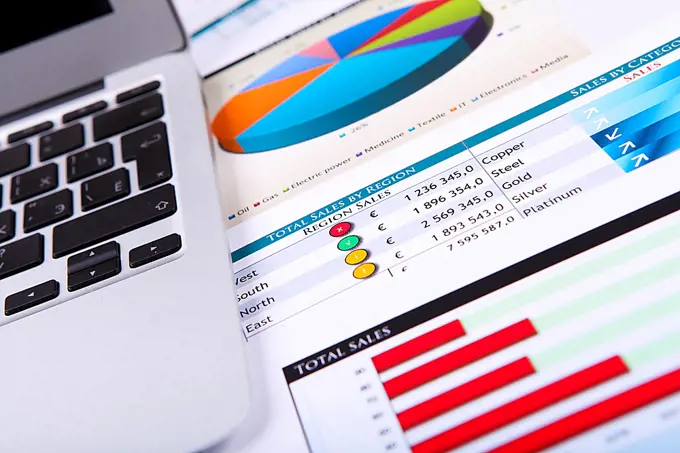
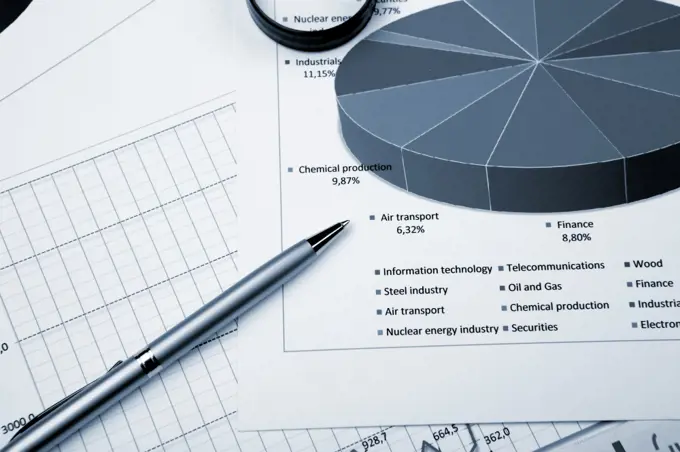
A collection of business reports, charts, and graphs for analysis. Visuals include laptops and financial tools in a professional setting.

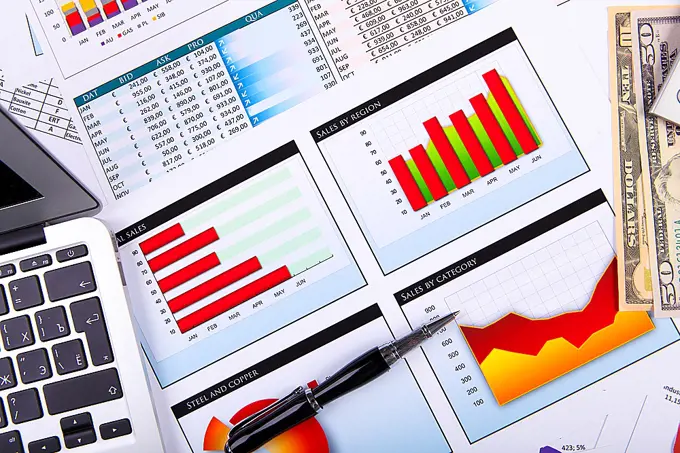
A collection of business reports, charts, and graphs for analysis. Visuals include laptops and financial tools in a professional setting.