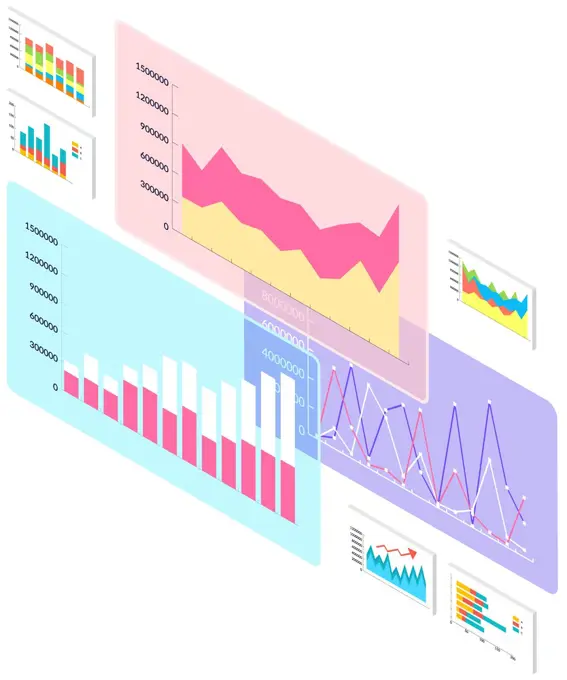
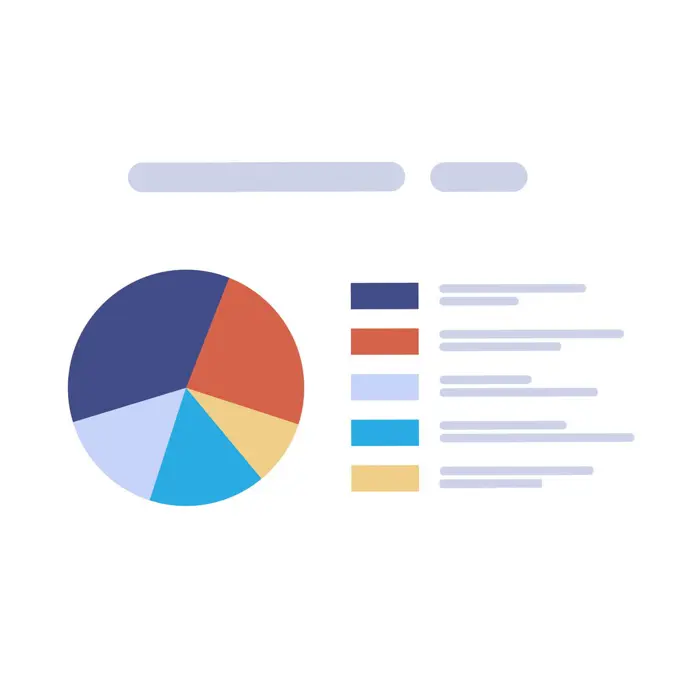
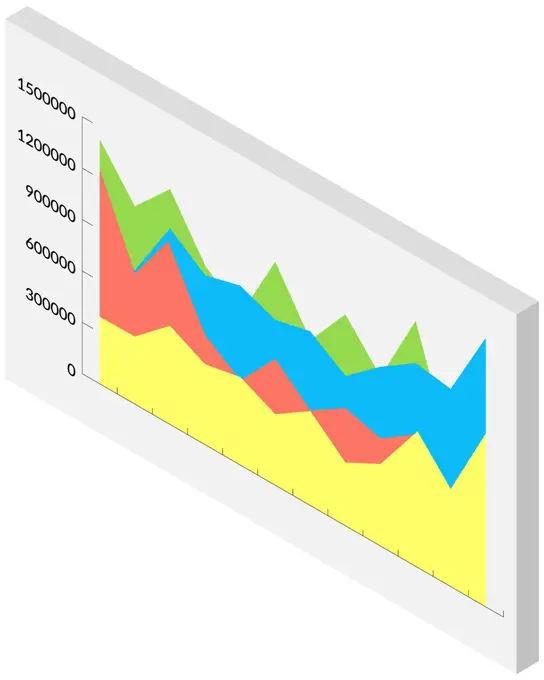
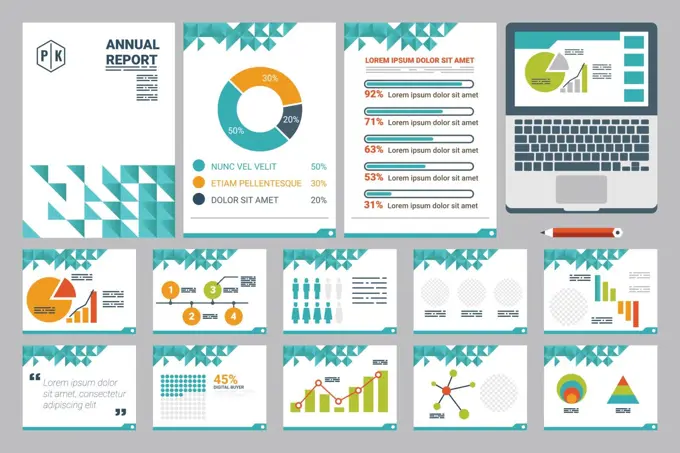
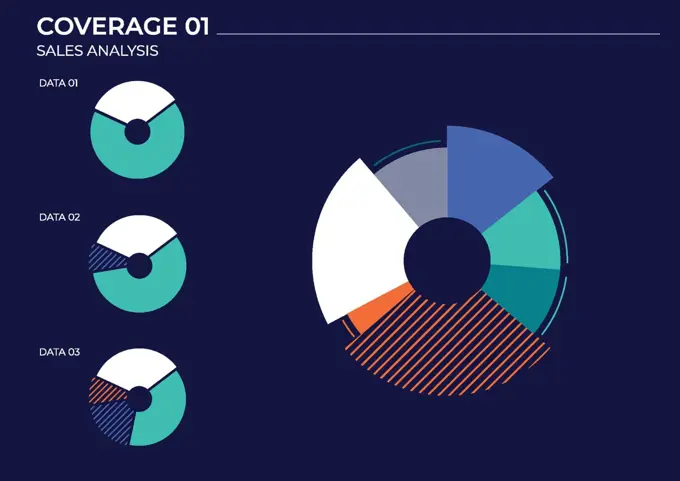
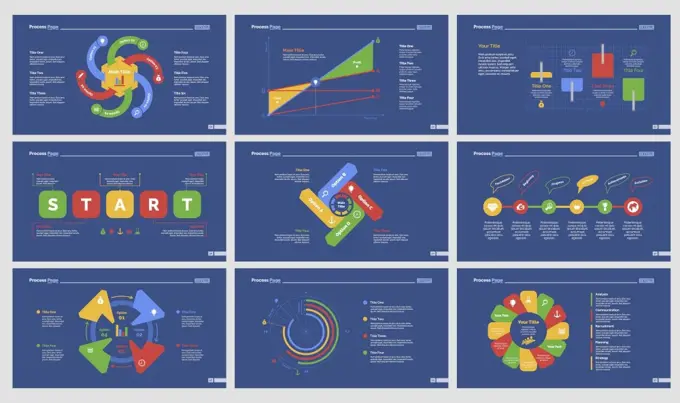
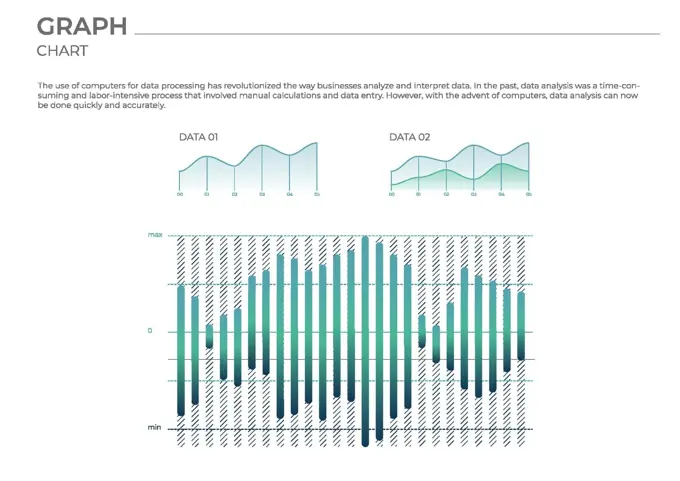
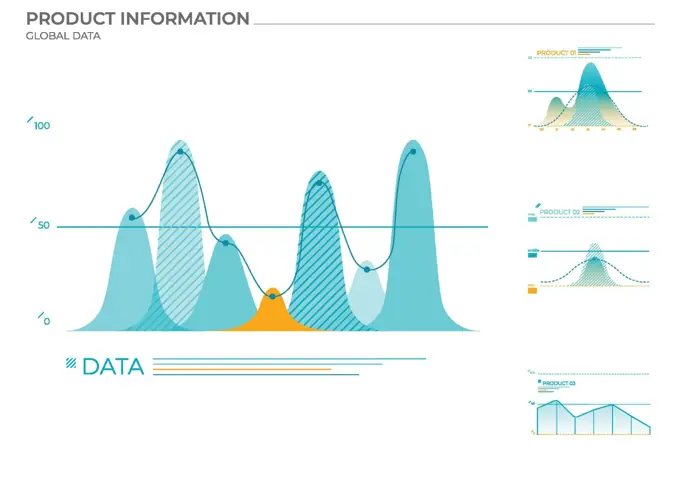
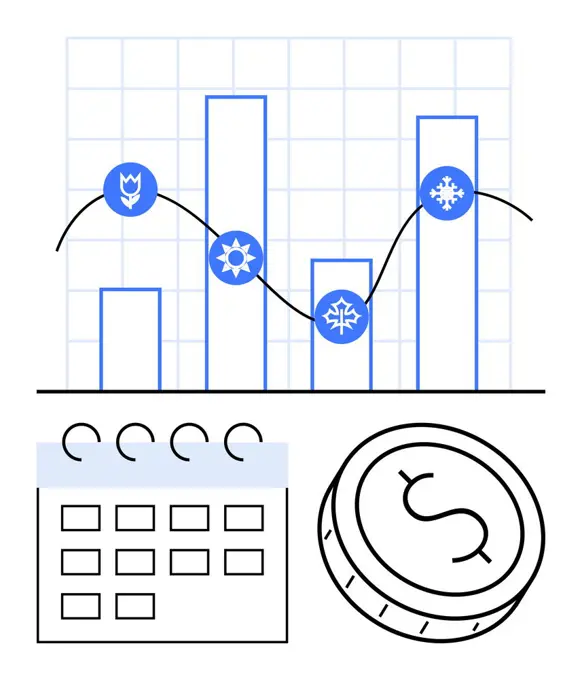
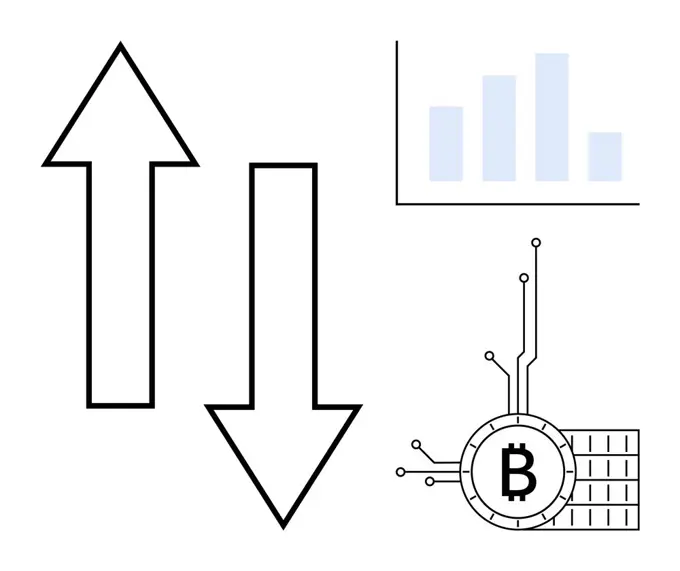
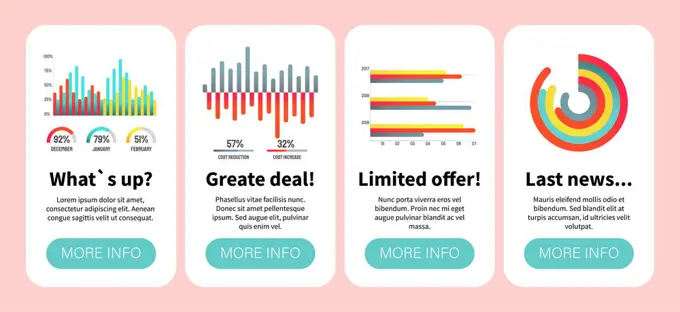
Business Data Analytics VisualsA collection of colorful charts and graphs for business analytics. Includes bar graphs, pie charts, and statistical data presentations, ideal for marketing and financial reports. Vector infographic charts 143 assets in this story1525-261962305507-421072571525-675320665507-443366871525-228580471525-264145811525-570743401525-219444561525-205918721525-279319791525-267858081525-756631551525-267574911525-271480941525-674962291525-261961161525-270417471525-267858091525-259154391525-268377526188-600646371525-650042151525-264153725507-428724201525-650046581525-220980851525-681914215507-401612925507-598023741525-219685461525-245772871525-274618111525-267573111525-682191355507-350444811525-574087465507-597956441525-278125191525-674990351525-569474341525-259540291525-276825905507-598023611525-244915871525-568239601525-700173691525-681605951525-280492641525-267573171525-267580015507-346617491525-675322521525-283003941525-271149021525-282749431525-240528171525-267571461525-267579791525-561436691525-262058631525-568851421525-284343561525-241500671525-275670611525-644477615507-394699591525-762307461525-680290121525-569419551525-257852521525-680288981525-758604471525-205920431525-676100511525-205918651525-571342131525-206351951525-569255901525-561616161525-675534051525-268850521525R-150971561525-277218771525-574022901525-674986121525-278124151525-206062601525-245772481525-674967805507-399499241525-277225671848-599872671525-569250401525R-151006591525-270463405507-575178481525-271766215507-537366221525-241147221525-75955860 PREVIOUS of 2 NEXT