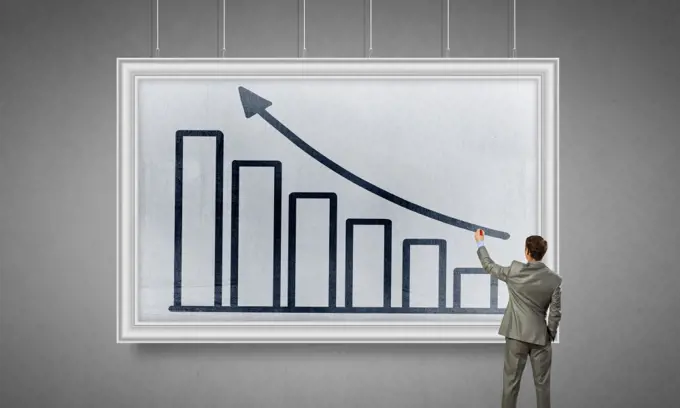
Business Growth and StatisticsIllustrations of graphs and charts depicting growth and decline, representing business metrics and financial progress. Media interface. Businessman hand pushing business graph on touch screen interface 315 assets in this story1525-281201931525-257258351525-257072571525-256186541525-269369481525-262162291525-235898411525-272425431525-257285701525-257052581525-561699111525-231907931525-250365971525-231678161848-504332785507-373078795507-439351731525-257044161525-236700441525-207736335507-349564961525-239788771525-263621771525-282110151525-232373331525-259996135507-449628581525-214779841525-281493731525-761007685507-324870171525-238070831525-240998801525-270734485507-356228791525-198521921525-240380011525-569477281525-226307715507-405268271525-271786151525-282373695507-475930861525-568587611525-234557491525-226453831525-246417081525-225600731525-224549121525-229196031525-235550451525-231921691525-273256291525-226632461525-257273511525-236066111525-247065571525-213649531525-207892271525-203326391525-235236921525-257071445507-439352901525-256106081525-269545921525-283171911525-257786271525-226202701525-674963521525-268019971525-278063701525-257051751525-573260191525-231622421525-226849481525-247061295507-438614621525-224905631525-280115931525-226246091525-568688291525-267045801525-282424675507-315683385507-421046001525-281816781525-237828221525-281922181525-278377616188-622679171525-572315691525-228257171525-211556271525R-1144636188-655742431525-216734961525-268853375507-423421451525-265414871525-56228801 PREVIOUS of 4 NEXT