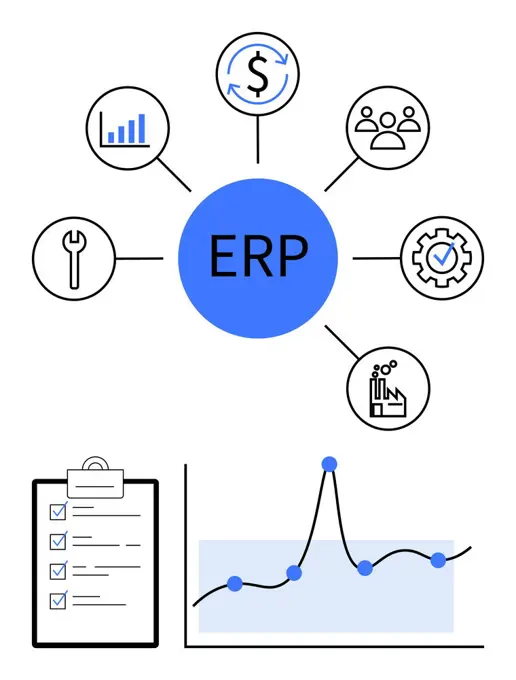
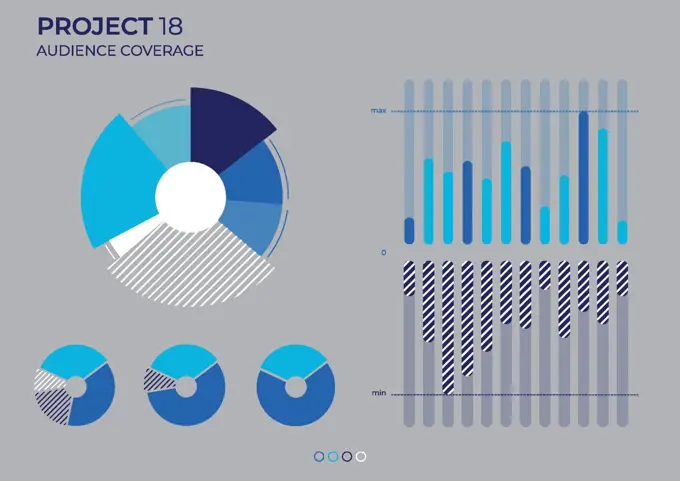
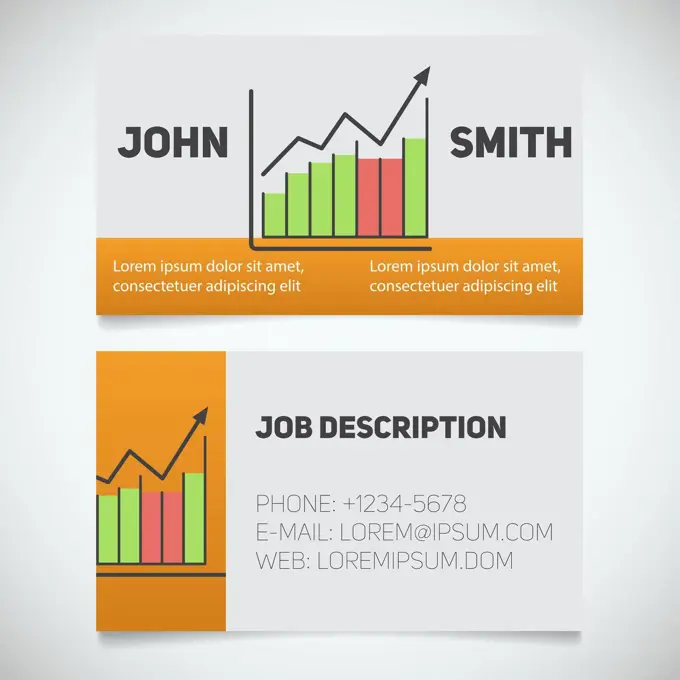
Data Analytics and VisualizationColorful illustrations of bar and line graphs, checkmarks, and clipboards representing data analysis and performance metrics. growth 321 assets in this story1525-674989701525-759355185507-602685021525-233643121525-269933115507-305752641525R-147984111525-265548191525-254677015507-476890135507-480077431525R-148020291525R-148019071525-568801041525-259741945507-340589271525-569194581525-277881241525-271148235507-466588471525-26248124 PREVIOUS of 4 NEXT