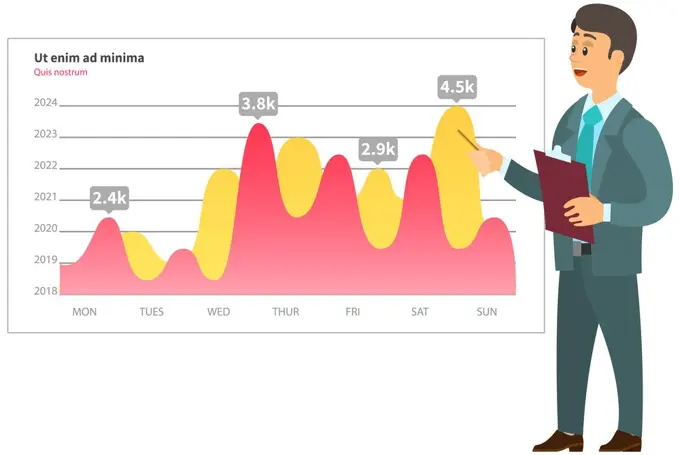
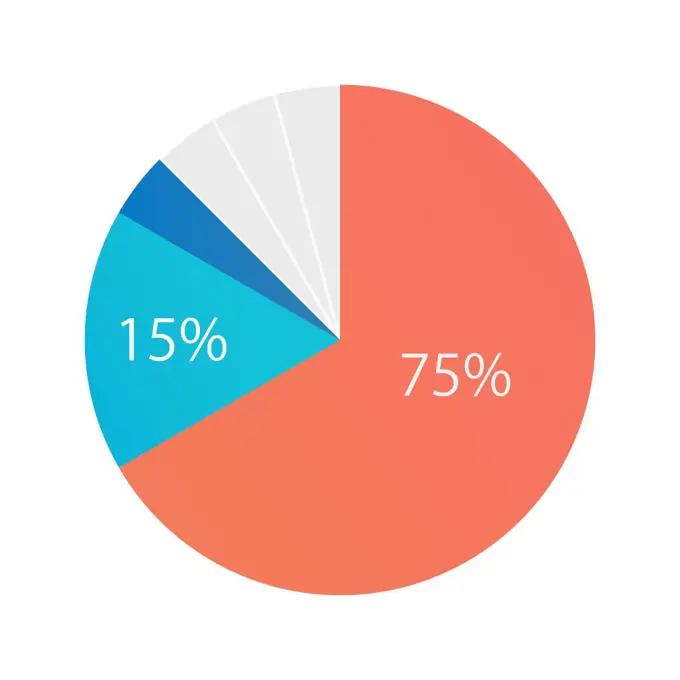
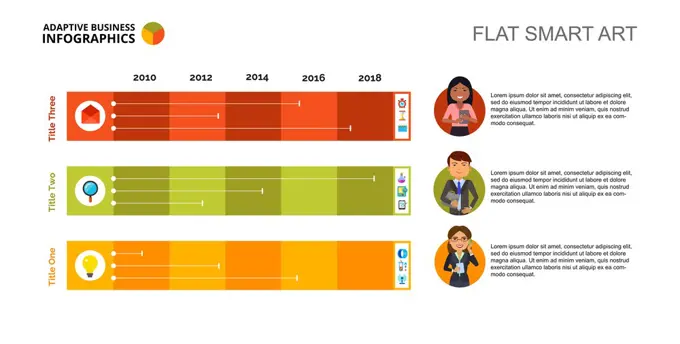
Data Growth and AnalysisColorful graphs and charts illustrating business growth and optimization. Modern design elements highlight data analysis, teamwork, and strategic planning. Pie chart isometric vector illustration. 101 assets in this story1525-682179381525-561438811525-214175501525-681615141525-640662391525-277769111525-761448485507-452362851525-759644931525-254197681525-759644885507-384114691525-644543541525-677718531525-644527825507-325250861525-264398211525-222584521525-650050055507-460627801525-675308041525-567785411525-757455671525-675536331525-675315085507-378210271525-566605051525R-146859261525-271487301525-276827531525-245048271525-220845111525-675540681525-759861445507-475027791525-265037421525-203326231525-674999941525-219164861525-675534011525-640657011525-675014061525-759821431525-644562795507-476470881525-700176341525-274259085507-626976685507-409108831525-572760785507-315672451525-228092255507-334710351525-664322924197-667139341525-283959475507-428575091525-267598775507-475655225507-334710421525-644572545507-378731375507-533407835507-476716981525-246009171525-275640431525-759461601525-573991891525-281017391525-568851255507-352454011525-259087851525-258727721525-759698001525-245765771525-568830861525-758447451525-759821471525-245772491525-676097401525-568800851525-245764281525-674974291525-271148401525-282339401525-204238481525-281353041525-212194701525-219529731525-267645181525-760600635507-366530921525R-148019764128-181805021525-568562145507-350735971525-573991784128-181805081525-573990791525-26837555 PREVIOUS of 2 NEXT