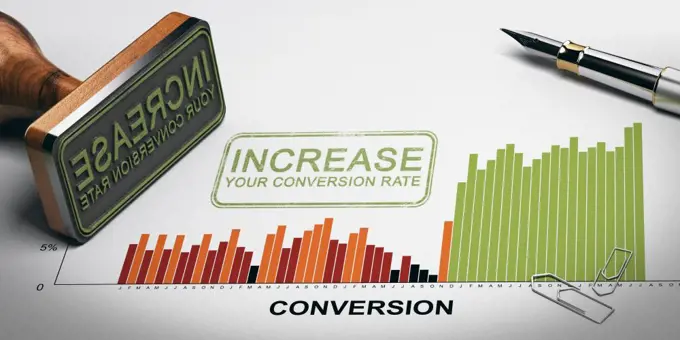
Growth and Data Analysis IconsVector graphics illustrating bar charts and arrows, symbolizing data growth, performance trends, and financial success for business presentations. Bar chart with rebounding and rising arrows, chart. Vectors. 277 assets in this story6188-623549931525-280460701525-758053821525-250567331525-571505025507-438848681525-756941825507-386049125507-382647721525-227841401525-573646145507-305751665507-403780825507-449641081525-271912811525-758061991525-241436541525-758061411525-680291951525-238195311525-562408855507-385055495507-443401711525-244981635507-443165015507-466588451525-270414561525-228484581525-264789055507-439335905507-478614061525-760044041525-279759261525-682191745507-512605415507-435999591525-573646561525R-148601805507-429597711525-230412781525-567785711525-271241665507-334689501525-240116691525-238345521525-275649791525-759743065507-305751181525-257212181525-561623521525-681606776188-600462855507-367716801525-245047701525-571521651525-283850571525-204782155507-318039861525-246110711525-569374045507-369649375507-336661001525-271191015507-436052041525-230414425507-446984325507-408386031525-204771541525-761000291525-271084691525-204777451525-268935781525-592485921525-760600331525R-148022951525-573990871525-27471911 PREVIOUS of 3 NEXT