My Boards
View Pictures
  • My Boards
← Science

Satellite Imagery of Natural Phenomena

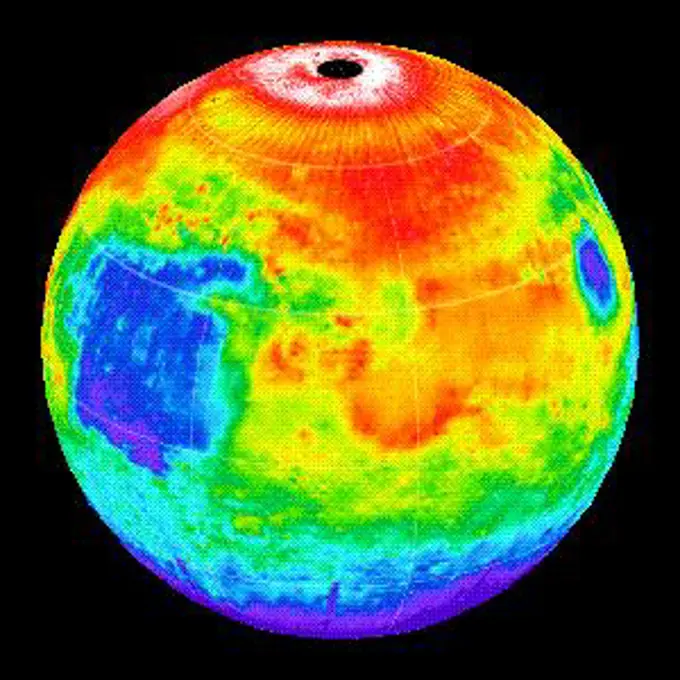
NASA satellite images capturing various environmental phenomena, including fires, volcanoes, and atmospheric conditions, with a focus on geological changes.

Venous doppler test in the lower limbs (observation of the after-effects post-phlebitis).
161 assets in this story
6145-44918486
These side-by-side, 3-D comparisons depict the unnamed lunar mountain targeted by the NASA's Gravity Recovery and Interior Laboratory (GRAIL) mission for controlled impact of the Ebb and Flow spacecraft.
6145-44531271
Nighttime Temperatures on Southern Io
6145-45299542
Thermal Electric Energy Conversion Module Cross reference to camera file 45548446
6145-44914026
NASA's CloudSat passed over Sandy at 10:32 a.m. EDT on Oct. 27, 2012. Light to moderate precipitation associated with parts of the outer bands of Hurricane Sandy were moving on shore into parts of North Carolina.
6145-44568401
Changing Lightning Storms on Jupiter
1532R-64020
Caramelized sugar
6145-45134685
Comparison of data from NASA's Cassini's radio and plasma science instrument, which can detect ring particles striking the spacecraft as it crosses the plane of the rings, on Dec. 18, 2016 (at top) and on April 26, 2017 (at bottom).
6145-44731154
MESSENGER Explores Interactions between Mercury's Magnetosphere and the Solar Wind
6145-54684354
. SWOT Captures the Yukon River in Alaska. The mighty Yukon River and nearby lakes appear in red in this image produced using data recorded on June 18, 2023, by the international Surface Water and Ocean Topography (SWOT) satellite as it passed over Alaska. The satellite measures the height of nearly all the water on Earth's surface, providing one of the most detailed, comprehensive views yet of the planet's ocean and fresh water. The mission is a collaboration between NASA and the French space agency, CNES (Centre National d'Études Spatiales). SWOT will address some of the most pressing climate change questions of our time, offering insights into areas including how a warming world is accelerating Earth's water cycle, leading to more volatile precipitation patterns. SWOT will also help researchers better understand how climate change affects water storage in lakes, rivers, and reservoirs, and how communities can better manage water resources and prepare for floods and other disasters.
6145-44516373
Mars Gravity Anomoly Map
6145-45299293
This composite of images from the JunoCam imager aboard NASA's Juno spacecraft shows the eight circumpolar cyclones around a central cyclone located at Jupiter's north pole. The sizes of these cyclones range from 1,500 miles (2,400 kilometers) to 1,740 miles (2,800 kilometers) across  about the same distance from the southern tip of Texas to the border with Canada. The composite depicts the remarkable stability of the octogonal configuration No cyclones have arrived or disappeared since Juno began its mission in 2016. The evolution of Juno's elliptical orbit is bringing the spacecraft closer to the north pole on each pass. At the beginning of Juno's mission the northern polar cyclone was hidden in polar night, but as the Sun moves toward the northern hemisphere, it is beginning to emerge into the daylight. As a visible camera JunoCam can only take pictures when the cyclones are in daylight, it took four perijove passes to see all eight. The original JunoCam images used to produce this
6145-44710237
Water Past and Present
824-28704405
Research on chronic bacterial infections within Inserm. PhD student working on brucellosis bacteria with the help of a flow cytometer.
6145-44554747
High Spectral Resolution Image of Stripe
6145-44908652
This map from NASA's Dawn mission shows the global distribution of hydrogen on the surface of the giant asteroid Vesta.
1525-20313876
Infrared thermovision image panorama of Zagreb, showing difference temperature
6145-44861966
Measurements by NASA's Cassini spacecraft reveal temperatures in a high layer of Saturn's atmosphere known as the stratosphere and show the dramatic effects of the massive storm deep below.
6145-45016178
Using NASA's Herschel Space Observatory, astronomers have discovered that comet Hartley 2 possesses a ratio of 'heavy water' to light, or normal, water that matches what's found in Earth's oceans.
6145-44618134
Entering Saturn's Magnetosphere with a Boom
6176-59920824
Belarus vs Canada Basketball, smoke flag, Sport game
6145-44646859
Radar Flyby of Titan - April 30, 2006
6145-44953331
NASA's Curiosity Mars rover targeted the laser of the ChemCam instrument with remarkable accuracy for assessing the composition of the wall of a drilled hole and tailings that resulted from the drilling.
6145-44634903
NASA's Atmospheric Infrared Sounder instrument is able to peel back cloud cover to reveal 3-D structure of a storm's water vapor content, information that can be used to improve weather forecast models.
6145-44945969
Tectonic Complexity in Mercury's Impact Features
6145-44896063
Acquired by NASA's Terra spacecraft on in 2011, this image shows the Wadi As-Sirhan Basin in northwest Saudi Arabia, which has been steadily developing agricultural fields using center pivot irrigation by tapping into fossil ground water.
6145-44825508
Then and Now These images illustrate the dramatic improvement in NASA computing power over the last 23 years, and its effect on the number of grid points used for flow simulations. At left, an image from the first full-body Navier-Stokes simulation (1988) of an F-16 fighter jet showing pressure on the aircraft body, and fore-body streamlines at Mach 0.90. This steady-state solution took 25 hours using a single Cray X-MP processor to solve the 500,000 grid-point problem. Investigator Neal Chaderjian, NASA Ames Research Center At right, a 2011 snapshot from a Navier-Stokes simulation of a V-22 Osprey rotorcraft in hover. The blade vortices interact with the smaller turbulent structures. This very detailed simulation used 660 million grid points, and ran on 1536 processors on the Pleiades supercomputer for 180 hours. Investigator Neal Chaderjian, NASA Ames Research Center; Image Tim Sandstrom, NASA Ames Research Center
6145-44888359
This map, made from data obtained by NASA's Dawn spacecraft, shows the distribution of pyroxene, an iron- and magnesium-rich mineral, in the southern hemisphere of the giant asteroid Vesta.
6145-45083323
This map shows the route driven by NASA's Curiosity Mars rover from the location where it landed in August 2012 to the 'Pahrump Hills' outcrop at the base of Mount Sharp.
4128-20042870
Map showing mountain ridge terrain, illustration
6145-44857714
This graphic demonstrates the hiss-like radio noise generated by electrons moving along magnetic field lines from the Saturnian moon Enceladus to a glowing patch of ultraviolet light on Saturn.
4269-25936
Heart scintigraphy. Gamma scan of a heart affected by ischemia during physical activity (lack of blood).
1746-28969682
3-D image from NOAA Exclusive Economic Zone Mapping Project. Blow-up of area right at base of Oregon continental slope. oblique lineations at base of continental slope; are real features as sounding system artefacts are farther to west. 1989
6145-45072225
Data from the Alpha Particle X-ray Spectrometer (APXS) instrument on NASA's Mars rover Curiosity show an unusual enrichment of silicon in the rocks dubbed 'Wildrose' and 'Bonanza King,' relative to other rocks studied at Gale Crater on Mars.
1899-83971
Digitized thermal analysis of the steel basement of the ALMA antenna.
6145-44641777
This global infrared map of Titan was composed with data from Cassini's visual and infrared mapping spectrometer taken during the last two Titan flybys
6145-44945317
This set of images illustrates how the science filters of the Mast Camera (Mastcam) on NASA's Mars rover Curiosity can be used to investigate aspects of the composition and mineralogy of materials on Mars.
1525-56190207
Sensory nerve fibers innervate muscles and tendons, ligaments, joint capsule to carry proprioceptive impulses to the central nervous system 3D illustration. nerve fibers innervate muscles and tendons, ligaments, joint capsule to carry impulses to the central nervous system.
6145-45031341
This graphic combines a perspective view from NASA's Mars Reconnaissance Orbiter of the 'Botany Bay' and 'Cape York' areas of the rim of Endeavour Crater on Mars, and an inset with mapping-spectrometer data.
6145-45261501
NASA's Airborne Visible Infrared Imaging Spectrometer instrument (AVIRIS), flying aboard a NASA Armstrong Flight Research Center high-altitude ER-2 aircraft, observed wildfires burning in Southern California on Dec. 5-7, 2017. AVIRIS is an imaging spectrometer that observes light in visible and infrared wavelengths, measuring the full spectrum of radiated energy. Unlike regular cameras with three colors, AVIRIS has 224 spectral channels, measuring contiguously from the visible through the shortwave infrared. Data from these flights, compared against measurements acquired earlier in the year, show many ways this one instrument can improve both our understanding of fire risk and the response to fires in progress. The top row in this image compilation shows pre-fire data acquired from June 2017. At top left is a visible-wavelength image similar to what our own eyes would see. The top middle image is a map of surface composition based on analyzing the full electromagnetic spectrum, reveali
6145-45104732
This image shows a region of the sea floor off the coast of northwest Greenland mapped as part of NASA's Oceans Melting Greenland (OMG) mission. The data shown here will be used to understand the pathways by which warm water can reach glacier edges.
6145-44572433
These two images were created using data from NASA's Spaceborne Imaging Radar-C/X-Band Synthetic Aperture Radar (SIR-C/X-SAR).
6145-44637400
This sea surface height map of the Gulf of Mexico and the northwestern Caribbean Sea, with the Florida peninsula on the upper right, is based on altimeter data from three satellites including NASA's Jason-1.
6145-44612293
What's on the Inside Counts
6145-44505568
Changes Observed in Just 4.5 Months at Prometheus, Io
824-63203295
Optical Coherence Topography (OCT) image, showing a macular map. On this image, the left eye to prevent glaucoma.
6145-45075864
Launched Sept. 21, 2014, to the International Space Station, NASA's newest Earth-observing mission, the International Space Station-RapidScat scatterometer to measure global ocean near-surface wind speeds and directions.
6145-45299282
The Western United States has been entrenched in an Extreme and Exceptional drought that has extended from the summer and into the fall of 2020. NASA's ECOsystem Spaceborne Thermal Radiometer Experiment on Space Station (ECOSTRESS) imaged the drought on Oct. 16, 2020, and compared the same area to an image from ECOSTRESS taken a year earlier on Oct. 16, 2019. The bottom image shows the percentage change in plant water stress from 2019 to 2020. The images at left zoom into the Arizona and New Mexico border and Navajo Nation Territory area, featuring the ECOSTRESS Evaporative Stress Index (ESI), which shows plant water stress. The inset images on the right zoom further into the region, showing circular agricultural fields that have been irrigated. Blue colors represent low stress and high water use, whereas red colors represent high stress and low water use. Irrigation is able to alleviate plant water stress in many of the fields while the surrounding landscape suffers from the drought,
6145-44575394
Martian Temperatures Measured by the Thermal Emission Spectrometer (TES). Isidis Planitia View
6145-44572028
Hematite Abundance on Martian Surface
4409-17348741
Surface weather map - Map of isobars.
6145-44875396
Holden Crater, a Finalist Not Selected as Landing Site for Curiosity
6145-44787519
Unfrozen brine in cryopegs and fracture networks provides habitats for the survival and growth of organisms both within and under frozen rocky materials on Earth and, by analogy, could provide habitats on Mars.
6145-44875395
More Than 60 Sites Considered for Next Mars Rover Landing
6145-58970735
jsc2020e030483 (4/20/2020) --- A preflight image sequence from parabolic flight experiments indicating motion of vapor bubble on heated ratchet surface. Asymmetric Sawtooth and Cavity-Enhanced Nucleation-Driven Transport (PFMI-ASCENT) demonstrates a passive cooling system for electronic devices in microgravity using a microstructured surface. When fluids boil over flat heated surfaces in microgravity, vapor bubbles grow larger in size, causing poor heat transfer that can lead to damage of devices. Adding microscopic rachets on the surface may passively enable mobility of vapor bubbles and prevent this damage.(Image courtesy of: Techshot, Inc.)
6145-44609408
History Leaves Salts Behind
6145-45263814
When the polar vortex dips south it often makes headlines. Frigid air, usually confined to the arctic, spills into lower parts of the continent making it a chilly challenge for people going about their day. But there's a warm part to the story as well. While the eastern and southern United States were shivering in January the arctic was experiencing above average temperatures. In maps created with data by the Atmospheric Infrared Sounder (AIRS) on NASA's Aqua satellite, warmer-than-normal temperatures are colored in red and below average temperatures are colored in blue. Provided in geographic and polar projections, the maps show regions of unusually cold air hovering over the eastern and southern U.S., eastern Canada and Greenland in January. February shows colder-than-normal air blanketing the northwest U.S., Canada, Western Europe, northwest Africa and East Asia. In both cases, the arctic remains exceptionally warm. During most winters the polar vortex is like a giant counterclockwi
6145-44905287
Observations by NASA's Mars Reconnaissance Orbiter have detected carbon-dioxide snow clouds on Mars and evidence of carbon-dioxide snow falling to the surface.
6145-44554749
High Spectral Resolution Image of Barnacle
6145-44952040
As the Sample Analysis at Mars (SAM) suite of instruments on NASA's Curiosity Mars rover heats a sample, gases are released (or 'evolved') from the sample and can be identified using SAM's quadrupole mass spectrometer.
6145-45101259
The graph at right presents information from the NASA Curiosity Mars rover's onboard analysis of rock powder drilled from the 'Big Sky' and 'Greenhorn' target locations, shown at left.
6145-45101261
The yellow triangles on this graph indicate concentrations of the elements titanium and silicon in selected rock targets with high silica content analyzed by the APXS instrument on NASA's Curiosity rover in Mars' Gale Crater.
PREVIOUS
of 2
NEXT
2401 S. Ervay, Suite 206
Dallas, Texas 75215
United States
Get Started
Free ResearchMy BoardsMy Cart
For Creators
How To License Your ContentContributor PortalFrame of Mind
Resources
API accessPricing
Contact
+1 866 236 0087help@viewpictures.co.uk Contact form
©2026 View Pictures. All Rights Reserved. -A
This site is protected by reCAPTCHA and Google Privacy Policy and Terms of Service apply.