My Boards
View Pictures
  • My Boards
← Science

Satellite Images of Earth

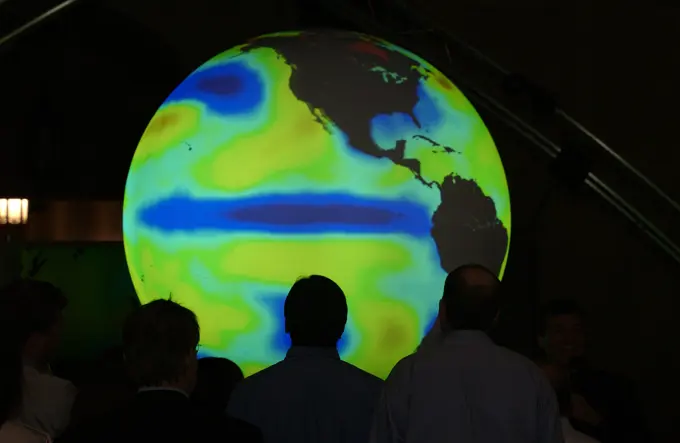
True color satellite images of Earth showcasing various regions, including Europe, Africa, Asia, and the Americas, with focus on detailed terrain.

Earth from space. Computer illustration showing the Earth as viewed from space, centred over India and the Arabian Sea. The Arabian peninsula (left) a...
143 assets in this story
1899-35461
Europe At Night With Country Borders, True Colour Satellite Image. True colour satellite image of Europe at night with country borders. This image in Lambert Conformal Conic projection was compiled from data acquired by LANDSAT 5 & 7 satellites.
1848-50242614
The Distribution of Human Races after Mueller and Peschel, 1895, digitally restored reproduction of an original from the 19th century
1746-29954672
Night view of North and Central America displayed on a globe at UN headquarters, Geneva, Switzerland 2017
4128-18301113
Global heatwave, illustration
1899-21290112
Western Europe at night in 2012, from Portugal to Moscow, Russia. This satellite image with country borders shows urban and industrial lights.
1525-19839771
Winter earth isolated on white background. 3d render. North Pole. Elements of this image furnished by NASA

1746-19662350
Composite satellite image of the continent of Africa
1525-23190504
Man painter. Young handsome man painter with brush in hand. Elements of this image are furnished by NASA
1525-25755956
Australia from space. Australia from space. Maps from NASA imagery. Australia from space
6176-67062256
False colour image of Antarctic ozone hole, 30 November 1992. Artist: Unknown
6177-V53546302
1899-21290140
Scandinavia at night in 2012, showing Norway, Sweden and Finland. This satellite image shows urban and industrial lights.
6145-44929674
This view of layered rocks on the floor of McLaughlin Crater shows sedimentary rocks that contain spectroscopic evidence for minerals formed through interaction with water. A combination of clues suggests this crater once held a lake fed by groundwater.
6145-44584961
Ignited by lightning strikes during a record-breaking heat wave, the Biscuit Fire became Oregon's largest wildfire of the past century. NASA's Terra spacecraft acquired these image between mid July and early September 2002.
6145-44946308
The Visible Infrared Imaging Radiometer Suite (VIIRS) on the Suomi NPP satellite captured this view of extensive sea-ice fracturing off the northern coast of Alaska. The event began in late-January and spread west toward Banks Island throughout February and March 2013. Visualizations of the Arctic often give the impression that the ice cap is a continuous sheet of stationary, floating ice. In fact, it is a collection of smaller pieces that constantly shift, crack, and grind against one another as they are jostled by winds and ocean currents. Especially during the summerbut even during the height of wintercracksor leadsopen up between pieces of ice. That was what was happening on the left side of the animation (seen here a href= http //bit.ly/10kE7sh rel= nofollow bit.ly/10kE7sh /a ) in late January. A high-pressure weather system was parked over the region, producing warmer temperatures and winds that flowed in a southwesterly direction. That fueled the Beaufort Gyre, a wind-driven
1848-76363844
Earth cut-away with visible iron core and all the geological layers in scale
6145-44015945
National Oceanic and Atmospheric Administration - SCIENCE ON A SPHERE
6145-44016165
National Oceanic and Atmospheric Administration - SCIENCE ON A SPHERE
6145-29095084
1860 James Polar Projection of the Globe - Antarctica - Pacific Center
6145-44878148
ISS028-E-033099 (18 Aug. 2011) --- Sicily is featured in this night time image captured by one of the Expedition 28 crew members aboard the International Space Station, approximately 220 miles above Earth. The land mass in upper right corner is part of the "toe" of Italy's"boot." A 32-mm focal length was used to record the image.
1848-66244081
World Earthquake Map, Fault Lines, Epicenters, and Seismic Activity
1899-21290126
Japan and Korean Peninsula at night in 2012. This satellite image with country borders shows urban and industrial lights.
6145-58971698
This animation shows global sea level data collected by the Surface Water and Ocean Topography (SWOT) satellite during its first 21-day science orbit, which it completed from July 26 to Aug. 16, 2023. Red and orange indicate ocean heights that were higher than the global mean sea surface height, while blue represents lower-than-the mean. Sea level differences can highlight ocean currents, like the Gulf Stream coming off the U.S. East Coast or the Kuroshio current off the east coast of Japan. Increased sea surface heights can also indicate regions of relatively warmer water - like the eastern part of the equatorial Pacific Ocean during an El Niño - because water expands as it warms. The SWOT science team made the measurements using the spacecraft's Ka-band Radar Interferometer (KaRIn) instrument. With two antennas spread 33 feet (10 meters) apart on a boom, KaRIn produces a pair of data swaths (tracks visible in the animation) as it circles the globe, bouncing radar pulses off the water
1848-49250314
Rows of crops in field seen through magnifying glass held against illuminated terrestrial globe
1899-21290154
Northeast America at night in 2012, showing the Great Lakes and Northeast Regions of the USA and Canada. This satellite image shows urban and industrial lights.
1525-23669810
Man painter. Young handsome man painter with brush in hand. Elements of this image are furnished by NASA
6188-64551454
Asian elephant Distribution of Asian elephant Distribution
4128-V58569444
1788-22072466
Interior of the georama (Great Globe) at the Champs-Elysees, Paris, France, illustration from L'Illustration, Journal Universel, No 166, Volume VII, May 2, 1846. Digitally colorized image.
1899-21290093
Brazil at night in 2012. This satellite image with country borders shows urban and industrial lights.
6145-44877568
ISS028-E-024360 (10 Aug. 2011) --- This night time view of northwestern Europe is featured in this image photographed by an Expedition 28 crew member on the International Space Station. Several of the oldest cities of northwestern Europe are highlighted in this photograph taken at 00:25:26 Greenwich Mean Time (GMT). While the landscape is dotted with numerous clusters of lights from individual urban areas, the metropolitan areas of London (United Kingdom), Paris (France), Brussels (Belgium) and Amsterdam (Netherlands) stand out due to their large light footprints. The metropolitan area of Milan, Italy is also visible at lower left. This photograph was taken with a short camera lens, providing the large field of view recorded in the image. To give a sense of scale, the centers of the London and Paris metropolitan areas are approximately 340 kilometers distant from each other. The image is also oblique, or taken while looking outward at an angle from the station; this tends to foreshor
4128R-14058585
Australia seen from outer space
4409-17348717
Movement of tectonic plates.
1606-19081748
Coronavirus Website, Covid-19
4286-42113
computer weather map NOAA National Weather Service Boulder Colorado
6145-45254926
The annual ozone hole has started developing over the South Pole, and it appears that it will be comparable to ozone depletions over the past decade. This composite image from September 10 depicts ozone concentrations in Dobson units, with purple and blues depicting severe deficits of ozone. "We have observed the ozone hole again in 2009, and it appears to be pretty average so far," said ozone researcher Paul Newman of NASA's Goddard Space Flight Center in Greenbelt, Md. "However, we won't know for another four weeks how this year's ozone hole will fully develop." Scientists are tracking the size and depth of the ozone hole with observations from the Ozone Monitoring Instrument on NASA's Aura spacecraft, the Global Ozone Monitoring Experiment on the European Space Agency's ERS-2 spacecraft, and the Solar Backscatter Ultraviolet instrument on the National Oceanic and Atmospheric Administration's NOAA-16 satellite. The depth and area of the ozone hole are governed by
1525-28067989
Annual isotherms, vintage engraved illustration. From the Universe and Humanity, 1910.
6145-52137025
A computer screen in the Navy Space Command operations center displays the path of an orbiting satellite. Country: Unknown
6145-44741466
ER-2 ASHOE/MAESA Expidition art (P.I. S Hipskind) Airborne Southern Hemisphere Ozone Experiment; Measurements for Assessing the Effects of Stratospheric Aircraft - Aircraft Flight Path March 16, - November 1, 1994
1801-62864771
LDB Mexico Installation. London Design Biennale, London, United Kingdom. Architect: various, 2016.
6145-54429154
A view of a map illustrating the primary Eastern Test Range (ETR) bases and stations. Country: Unknown
4409-28578641
Computer graphics about the geography and climatologic characteristics of the Bermuda triangle, an area in the Atlantic Ocean that is famous for the disappearance of ships and planes. Adobe InDesign (.indd); 4960x3188.
6145-54443035
A map depicting deployment of Soviet strategic long-range bombers. Country: Unknown
PREVIOUS
of 2
NEXT
2401 S. Ervay, Suite 206
Dallas, Texas 75215
United States
Get Started
Free ResearchMy BoardsMy Cart
For Creators
How To License Your ContentContributor PortalFrame of Mind
Resources
API accessPricing
Contact
+1 866 236 0087help@viewpictures.co.uk Contact form
©2026 View Pictures. All Rights Reserved. -A
This site is protected by reCAPTCHA and Google Privacy Policy and Terms of Service apply.