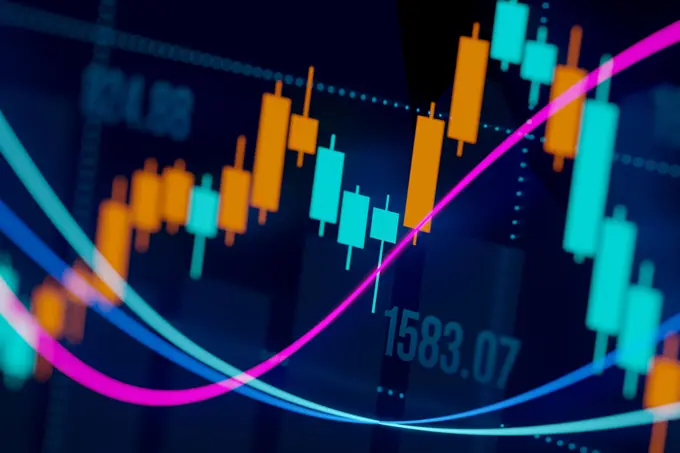
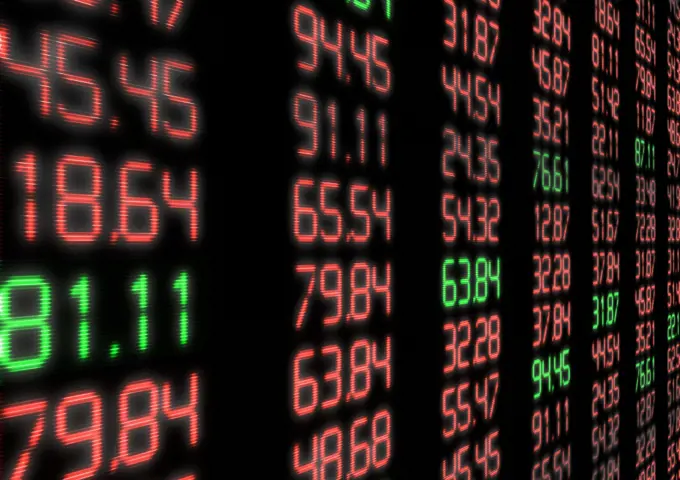
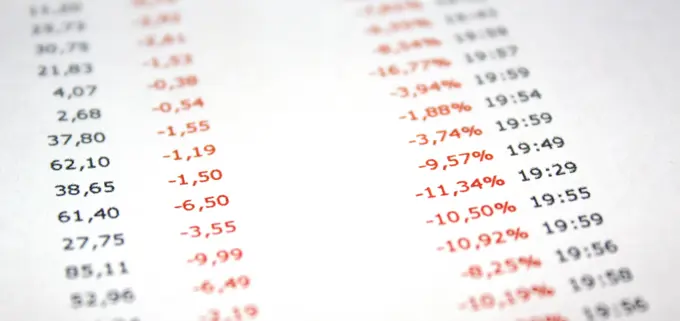
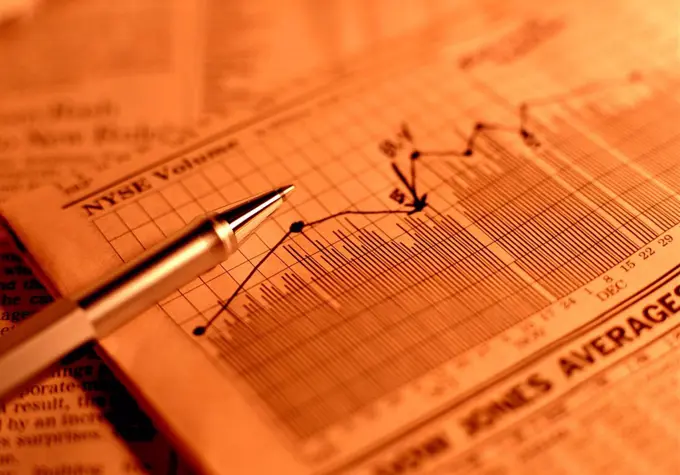
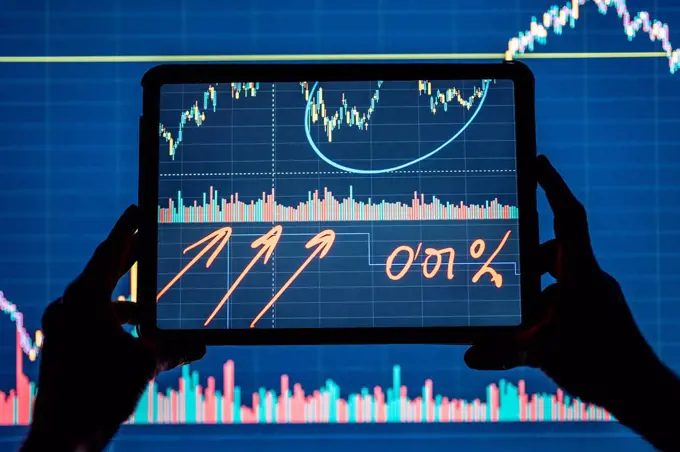
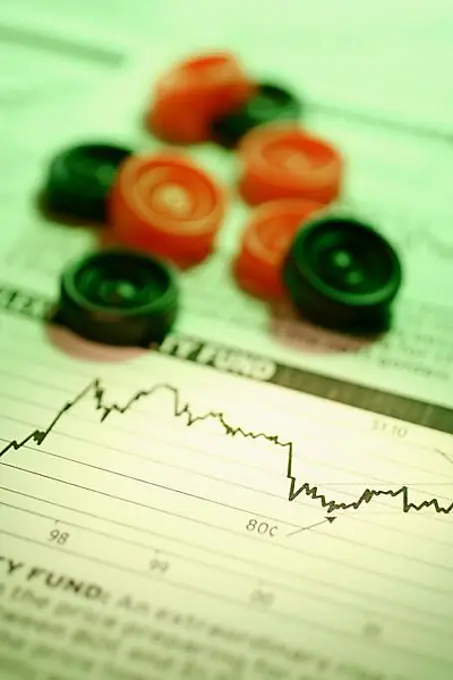
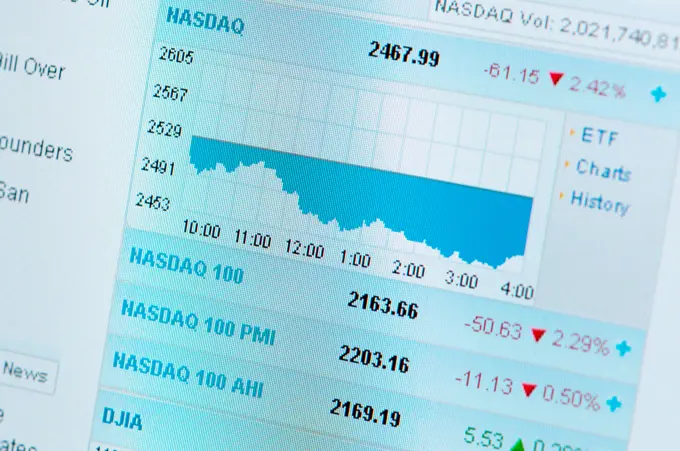
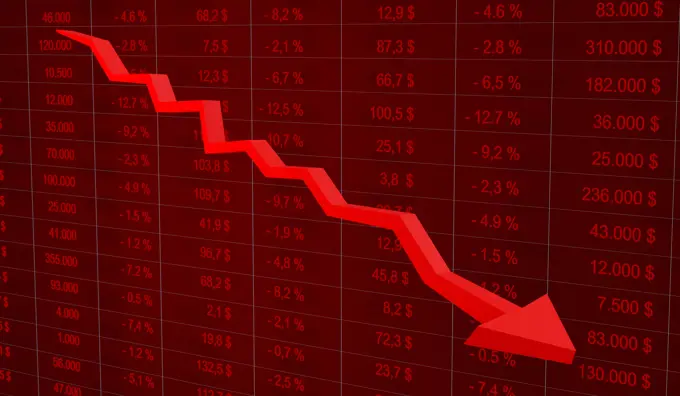
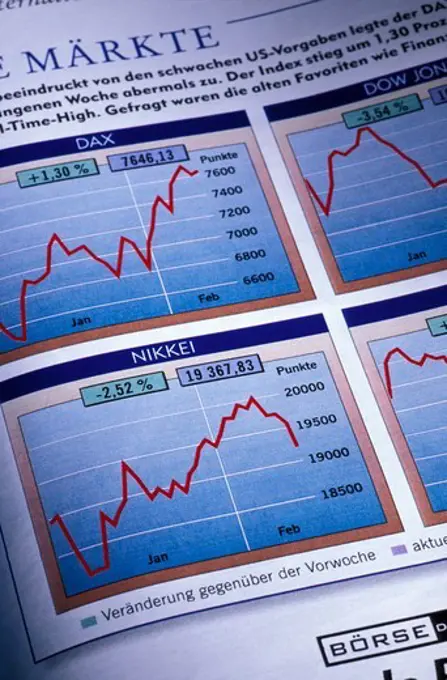
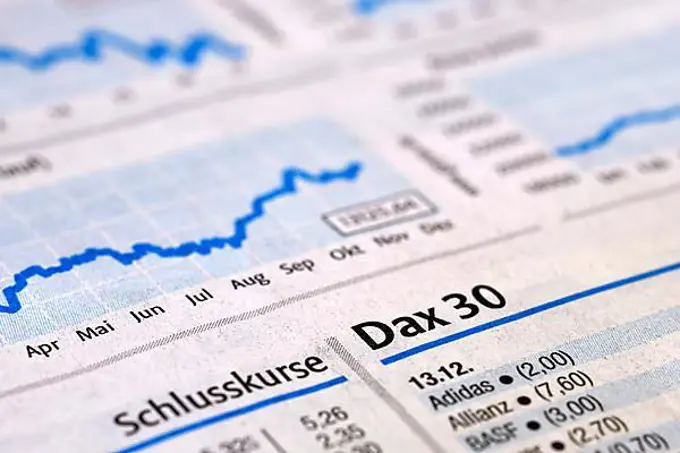
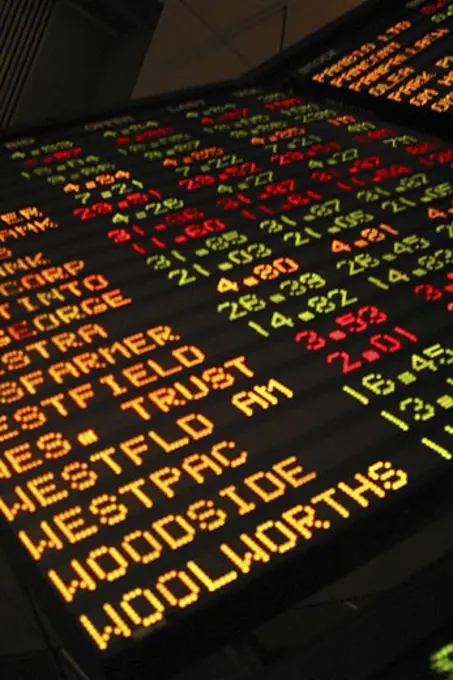
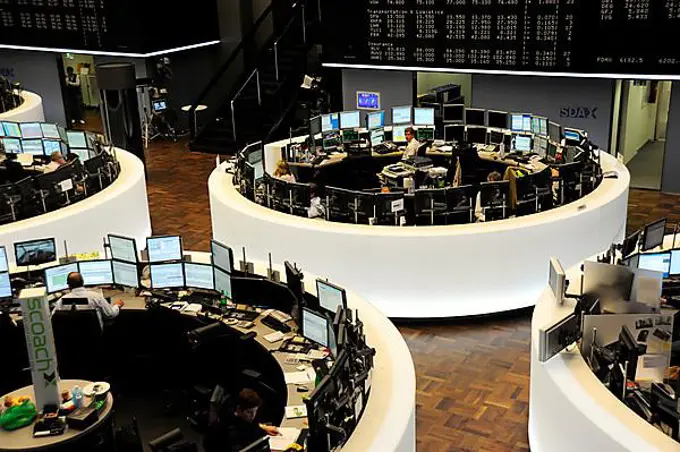
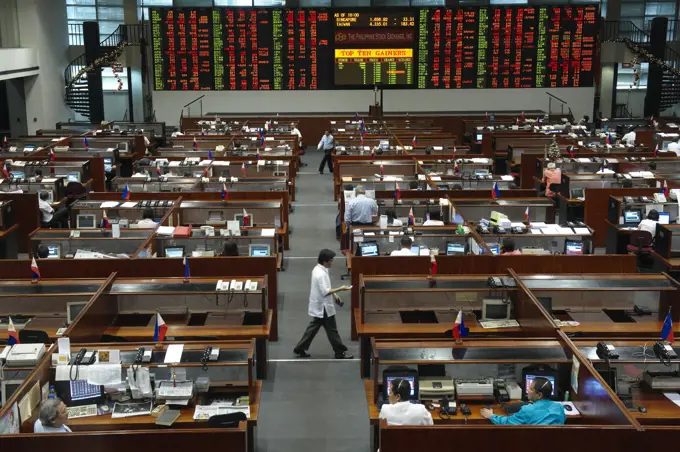
Stock Market AnalysisClose-up images of stock market charts featuring candlestick patterns, moving averages, and fluctuating trends. The style is modern with a focus on finance. City analyst viewing financial market data with pen on touch screen 148 assets in this story6188-556000146188-555889341525-245501351848-511389601525-565445381815-650566026188-600106541525-230373391525-258852401525-252348951525-570778366188-556367531525-203658701525R-2354831525-564338061815-1116622561990-527381525-236840191525-562449681815-186613611525-223574811525-284349941525-239381641525-251390211525-221516831848-553085341525-267109506188-690598991525-564754761525-230372231525-224388794286R-103321525-258635471525-229977864197-641722454197-V725561256188-648191175507-449506751525-232217376188-549149124197-V779006771525-244026821525-233552214449-708911525-234102571525-569796911848-513388511525-265270515507-340383991525-269939131525R-1285981525-230372531525-240439066188-600457391525-570032231525-251204366188-600112201439R-10713406188-690599141848-516968874449-330586188-633453061525-225965781525-573646555507-317774091848-600850301848-513544611525-238234561848-601621805514-538929331525-210665571525-251213975507-359729596188-600060661439R-1010211848-532392305507-384226131848-614524031525-664055575507-406556071525-268595731990-359651848-494676756188-600062721439R-1010221525-230394796188-600089995507-340384131525-760071801525-256747631848-601621186188-655446031525-664030806188-600116331848-549586741439R-11114695507-426926134292-209277110-703652111525-57408947 PREVIOUS of 2 NEXT