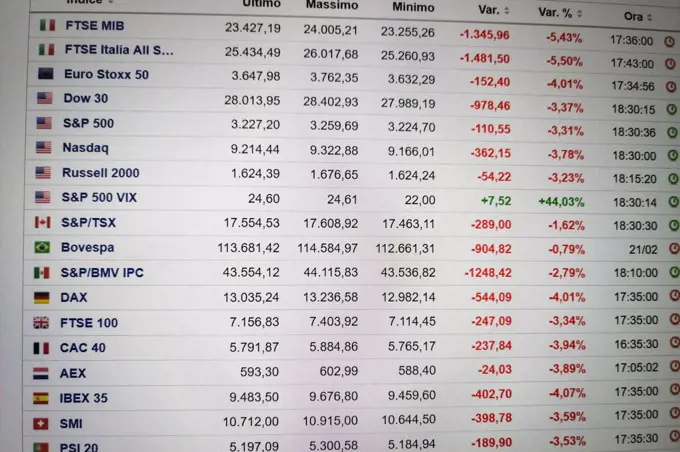
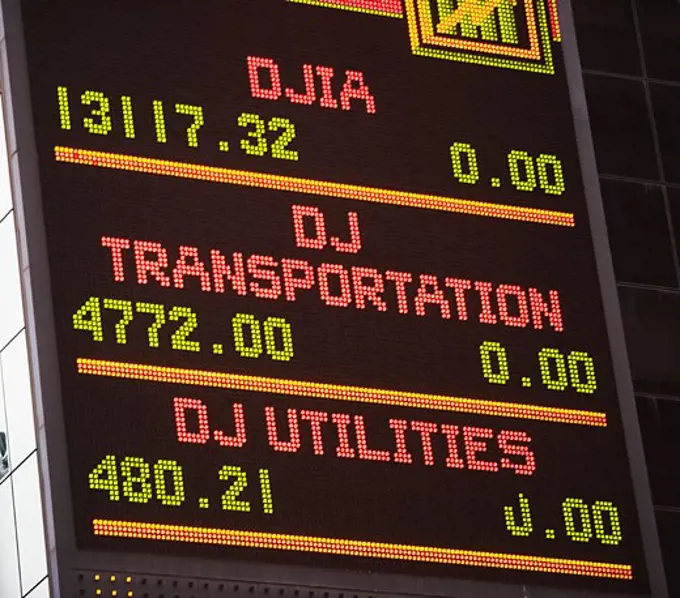
Stock Market Trading Activities
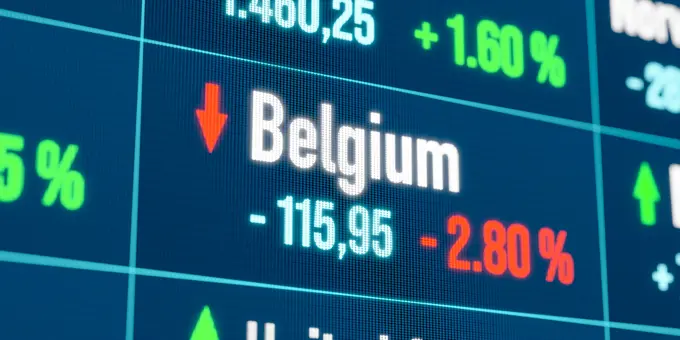
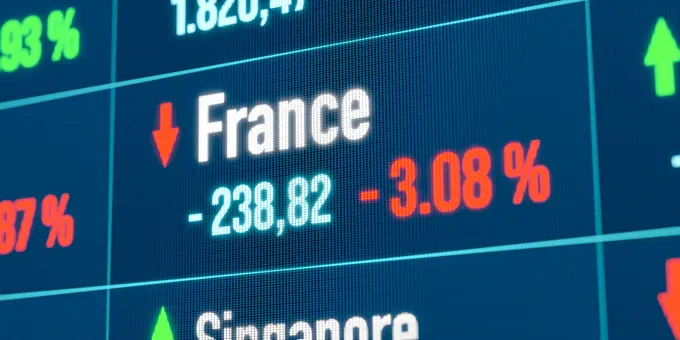
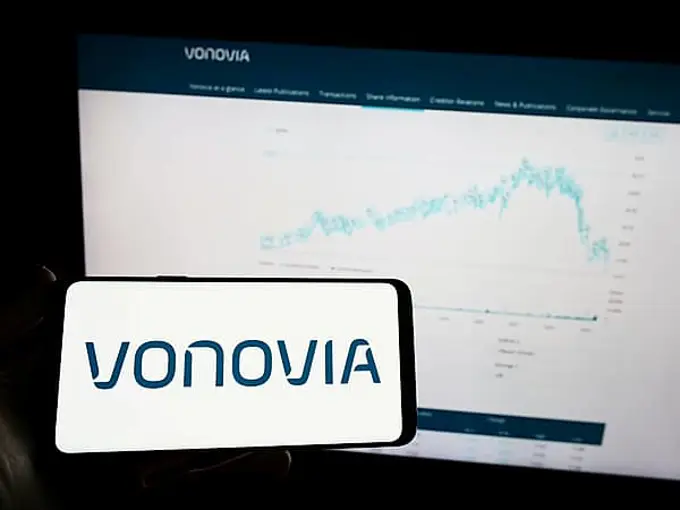
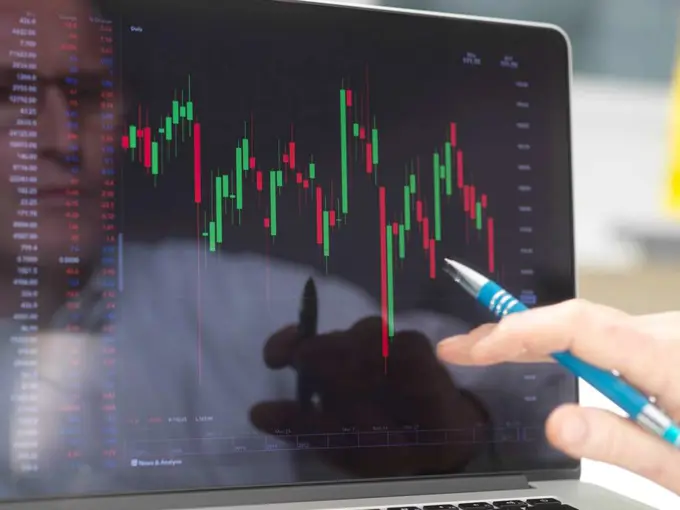
Visuals representing stock market activity with trading graphs, smartphone screens, and close-ups of financial data. Reflection of a stock trader viewing the performance of a company share price on screen 175 assets in this story1848-643946766176-601654891525-283360501848-600804381848-644021041848-644027861848-599818341848-601585701525-262684341899-160542511848-600849771848-547592511848-599635411525-227505881848-601583061848-599731716188-609749531848-599732126188-585153841848-601622401848-599460426188-609519541848-643954421848-601631591848-601915101848-601621131848-601584041525-283358427220-712385921848-643913751525-258745846188-609681226188-609976701848-788376601848-599572951848-599837066188-599925301848-788341481848-599819861848-600835401848-599552631848-599753511848-601616204286-178801848-599752231848-599864181848-643956481848-599741481848-599639491848-599610061848-600844826188-600537481848-599846301848-601588971848-600797581848-599565851848-601624981848-599655721848-644016831848-601967856188-600110891848-599613721848-601917961848-600798624186-586310431848-649148241848-599642281848-599648564055-36576188-600094435507-466102931848-601633986177-V549926321795R-109655507-33845863 PREVIOUS of 2 NEXT