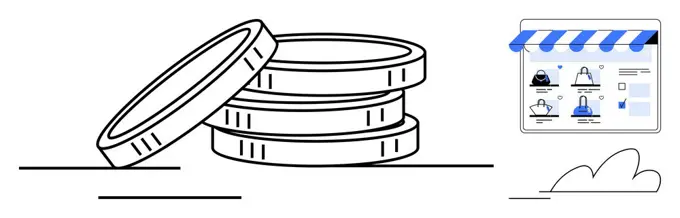
Business Data VisualizationSimple line and bar graphs on computer screens, arrows, and promotional designs for e-commerce, ideal for business strategy and progress tracking. Fuel prices upping. Inflation or business problems. Line vector illustration 173 assets in this story1525-675514241525-676100601525-674996381525-674951031525-675309861525-675020601525-256686791525-675545081525-674698915507-335066251525-762347021525-675322161525-676099271525-666326361525-680288481525-681912781525-681612771525-650061991525-675316781525-569467651525-675527181525-650064591525-674977521525-674999311525-675298801525-675309131525-675320191525-675302521525-674945651525-674949401525-674704031525-675542861525-675525901525-265466981525-674948291525-700176741525-674978201525-263124701525-674705046188-651713541525-674951461525-675319181525-675020661525-644563601525-674962041525-700176801525-644499411525-674952991525-674693061525-668640574197-V653695871525-681910561525-674947971525-644567601525-210236601525-681618841525-282134811525-674717701525-666326431525-682177801525-676103991525-675314991525-236245661525-263243401525-676095511525-675320391525-675305496188-645312101525-644565411525-674999961525-675011204197-V730482911525-676102901525-677713161525-674712601525-675301191525-267728431525-572613781525-279503505507-483474661525-675302591525-675535841525-674978131525-650074551525-729017981525-268662001525-277733041525-644563335507-375848561525-677718521525-674945241525-650055854197-V677148186177-V536217601525-570842041525-666323931525-565609881525-674944195507-437417791525-21159483 PREVIOUS of 2 NEXT