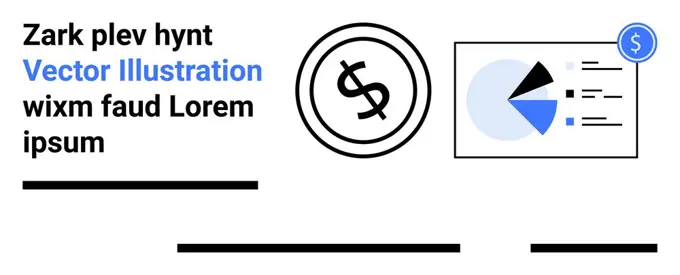
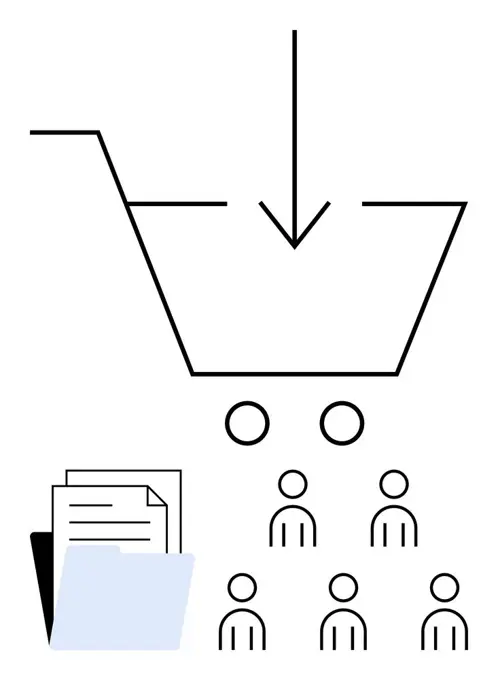
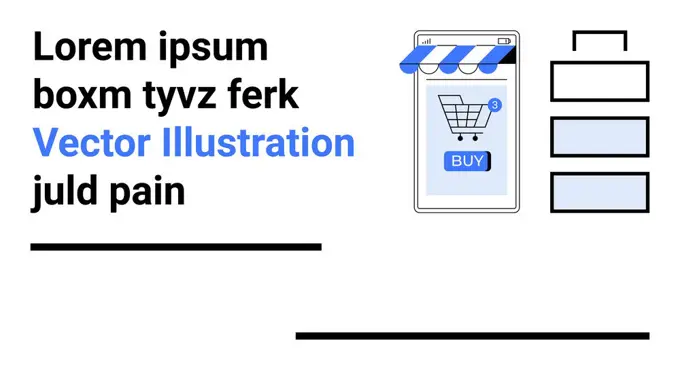
Business Data VisualizationSimple line and bar graphs on computer screens, arrows, and promotional designs for e-commerce, ideal for business strategy and progress tracking. Fuel prices upping. Inflation or business problems. Line vector illustration 173 assets in this story1525-570805491525-279126901525-675544921525-571136341525-564837001525-272008981525-681910551525-568675756177-V549935471525-568159981525-682190361525-568123441525-663963491525-666327061525-675525606203-V587472871525-681604461525-681912661525-644481591525-674969795507-439517566177-V535621691525-666323571525-672439861525-677716536177-V538379571525-219446141525-650061491525-675021104197-V730482941525-265606341525-238540901525-272955371525-254668076177-V536501131525-561695821525-270787471525-675307285507-367368031525-272768221525-569995995507-367804371525-223452271525-574456851848-539847375507-310133461525-684725005507-340697601848-498040551525-263619501525-270766011525-677719255507-452876221525-644487721525-644571801525-569318121525-279364965507-408282411525-257000561525-675523381525-282664435507-471421325507-410046881525-234895781525-675313201525-759461491525-675319621525-674948151525-759476131525-237097141525-674950121525-282339171525-64457004 PREVIOUS of 2 NEXT