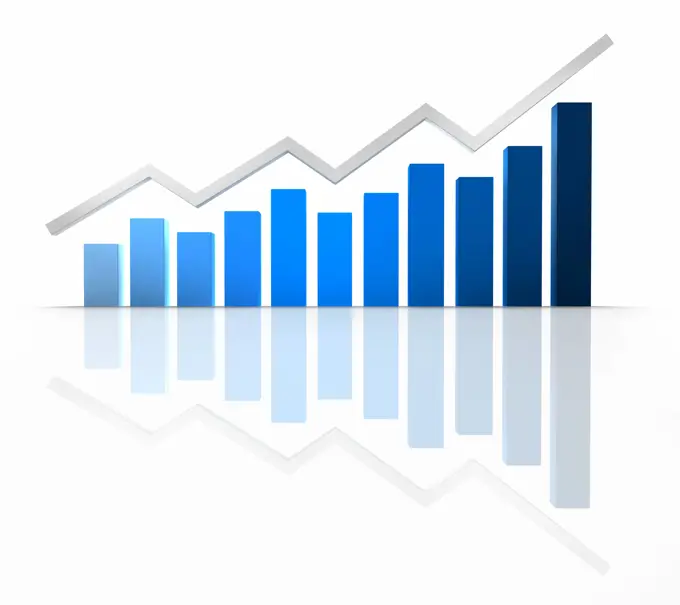
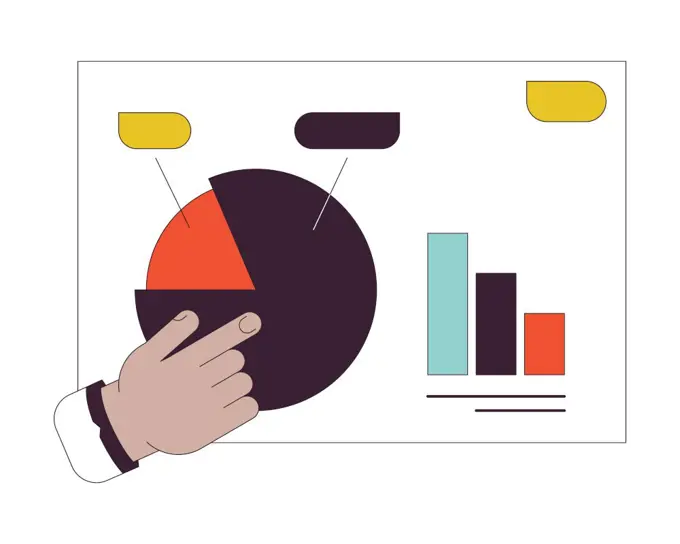
Data Analysis and GraphsVisual representations of bar and line graphs depicting growth trends, analytics, and reporting in a modern, colorful design. Rising bar chart and arrow icon. Investment and business data. Vectors. 262 assets in this story1525-236963911525-247399825507-315673291525-228558251525-206545001525-259069281525-562557911525-271184671525-282625065507-315674281525-562590541525-760289681525-281553511525-571710271525-570813255507-310133551525-282783125507-439353441525-277587961525-262076551525-277666865507-315682995507-314768145507-476457575507-474452035507-389217921525-227894711525-284008501525-573109641525-261014091525-568149041525-228213616188-560479105507-475027421525-570219201525-265327411525-282560945507-475895131525-281858171525-240492471525-261482661525-573278785507-439368705507-439346041525-569917021525-261961255507-384599421525-571010991525-283699485507-439393661525-261962281525-279167261525R-147736671525-675001421525R-1124385507-391556025507-314767971525-228258521525-242083111525-261014011525-663720191525-260214215507-357174171525-565029771525-573157421525-244992581525-246281451525-573284471525-224992121525-573896491525-227297011525-230388481525-246486491525-573989745507-430525581525-258833751525-569381061525-280667565507-443160985507-474478201525-562021691525-759166445507-477035091525-572580695507-476267101525-675322511525-668640391525-248474751525-259035915507-391349641525-570917815507-467500511525-261486595507-305765461525-207984121525-568847121525-230387471525-270299761525-268547681525-22566817 PREVIOUS of 3 NEXT