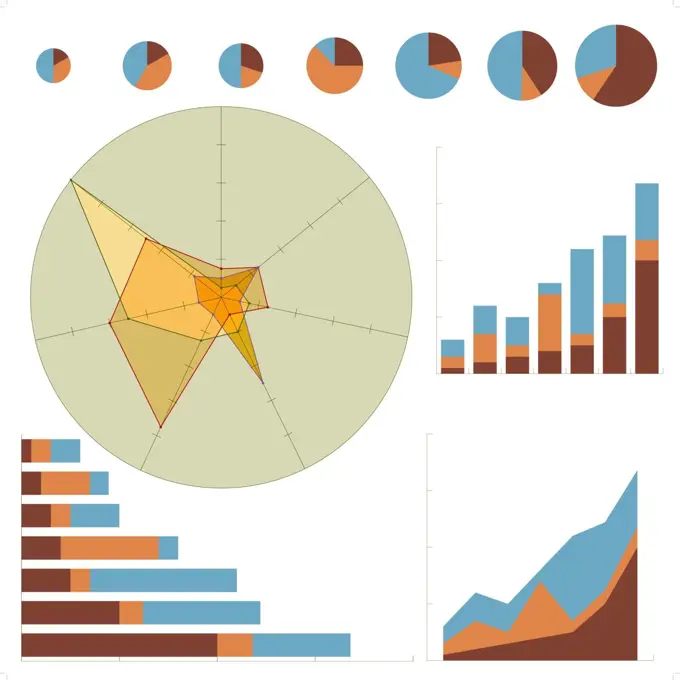
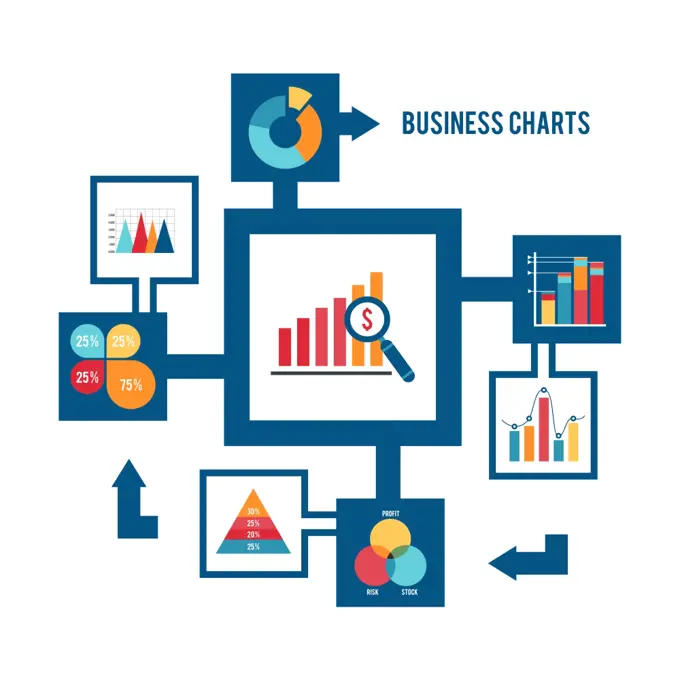
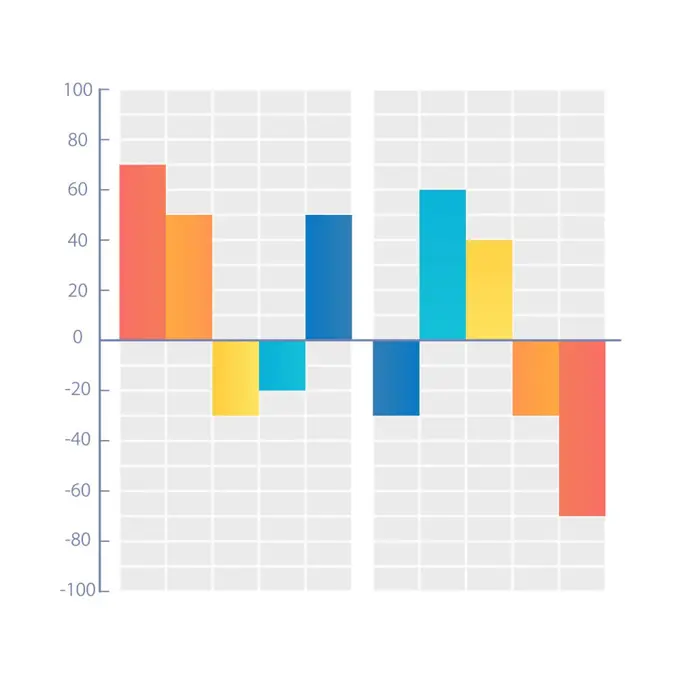
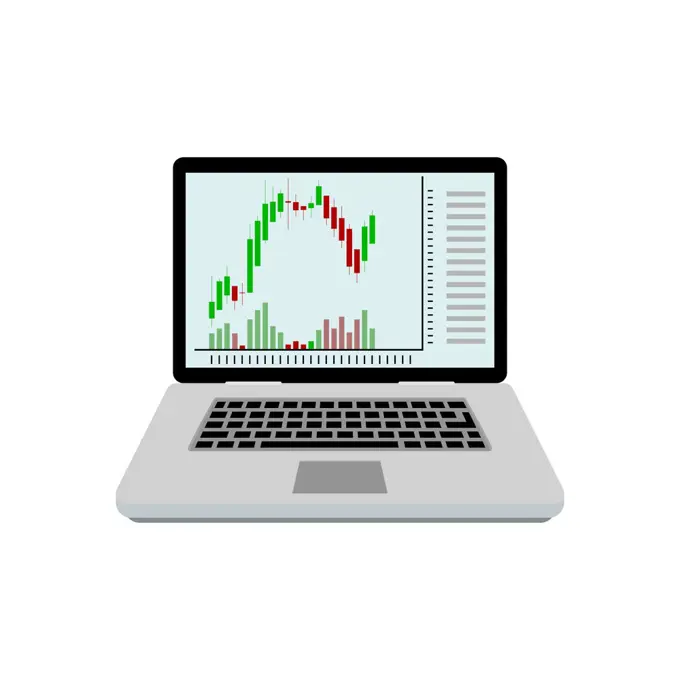
Data Analysis and GraphsVisual representations of bar and line graphs depicting growth trends, analytics, and reporting in a modern, colorful design. Rising bar chart and arrow icon. Investment and business data. Vectors. 262 assets in this story5507-410679061525-682185691525-254497741525-570831915507-512600645507-512596901525-208972841525-208153231525-758128091525-264459301525-284912361525-662664711525-675310281525-280200531525-640664371525-238024855507-420564991525-761448075507-509131305507-438737965507-478633081525-216190945507-438686665507-411075211525-674968915507-388654471525-757108491525-283357365507-321325145507-471822051525-675995991525-220508721525-566733825507-358526731525-283699161525-278159911525-243532511525-209371721525-267597821525-230383905507-609101715507-449577181525-282385935507-465594015507-336160131525-761065541525-268575485507-305783245507-512597395507-475930921525-570878585507-414366331525R-148565291525-574193721525-197426105507-334699591525-759821421525-267995245507-329897591525-215822511525-283964001525-562252411525-280844675507-455081145507-443275021525-255136961525-245204491525-570832091525-250591421525-759500941525-761365291525-572344965507-510294681525-275525225507-378364261525-674965941525-254405485507-428735971525-759698071525-245700921525-243775711525-251748575507-319865551525-269752891525-213862451525-663850501525-275180631525-215095021525-245152011525-265383861525-760606341525-569025871525-760608121525-561440151525-270227641525-205903071525-275535121525-574919855507-512589371525-20554755 PREVIOUS of 3 NEXT