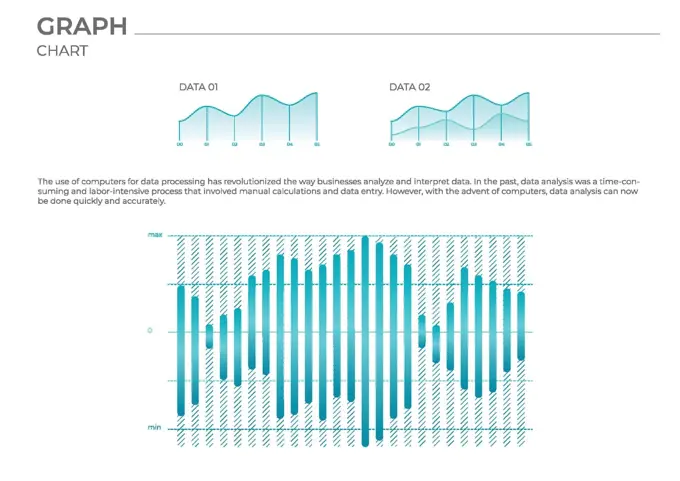
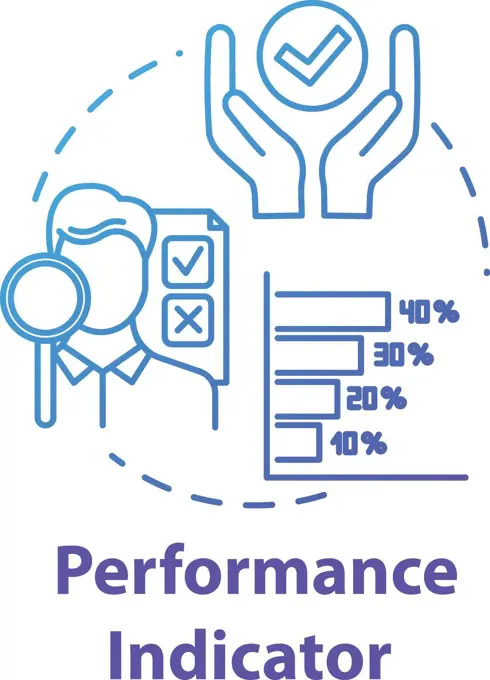
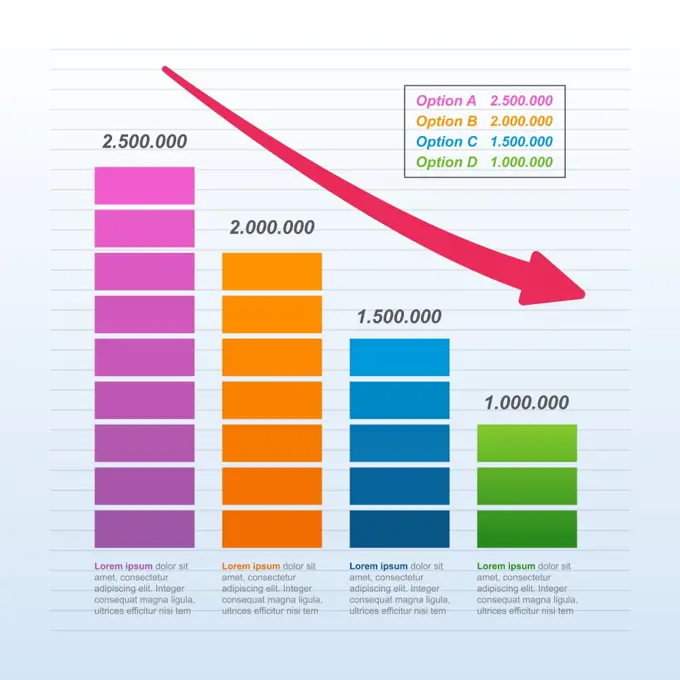
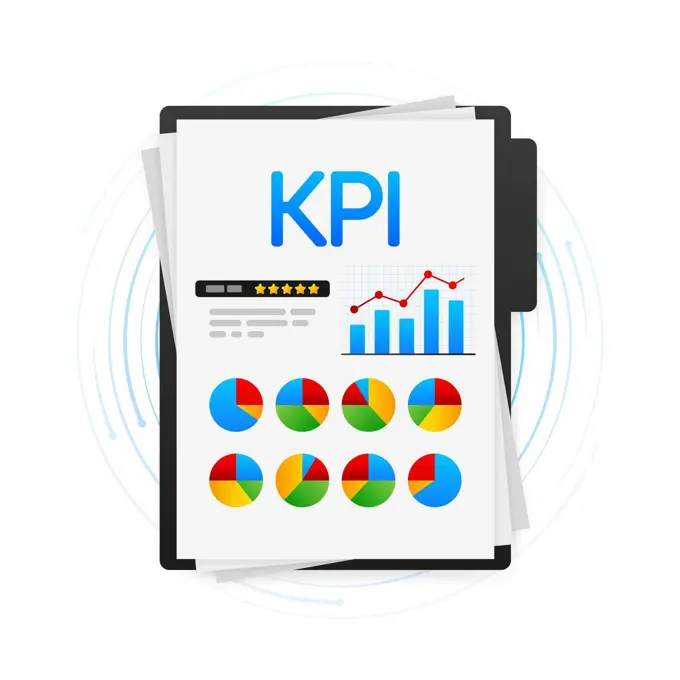
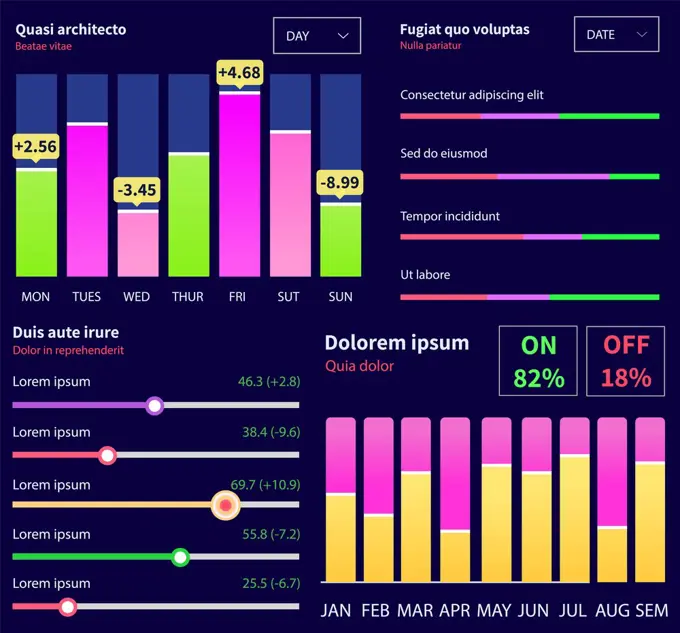
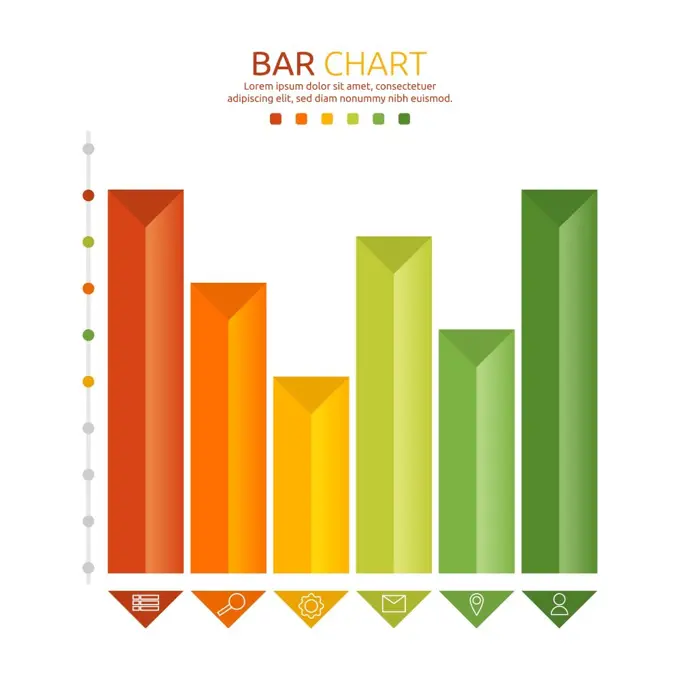
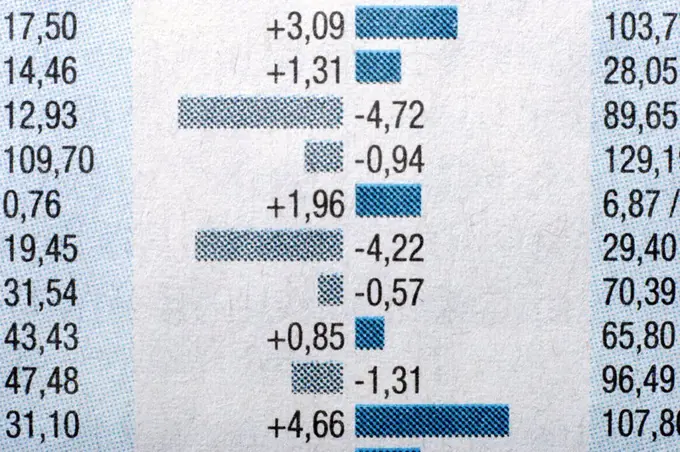
Data Analysis and GraphsVisual representations of bar and line graphs depicting growth trends, analytics, and reporting in a modern, colorful design. Rising bar chart and arrow icon. Investment and business data. Vectors. 262 assets in this story1525-267584031525-562616851525-269791631525-573337191525-267580025507-411080241525-277578161525-269745741525-567785265507-478618201525-237723145507-512589451525-762347391525-561620991525-567633481525-261082201525-644455696188-655755771525-284920331525-282953695507-452892981525-574717571525-270412231525-757125091525-573992855507-455109351525-571840105507-598023601525-205548931525-268215991525-276557675507-310689971525-675300711525-263450811525-255852301525-761962301525-245779585507-458280385507-318043725507-576350951525-567785731525-760825971525-268935811525-757390461525-574136111525R-147986551525-263561121525-283252211525-268002671525R-148021931525-636941875507-305765101525-267598971525-271148221525R-147989431525-204789721525-241051221525-274591571525-203546001815R-616115507-459082195507-30577009 PREVIOUS of 3 NEXT