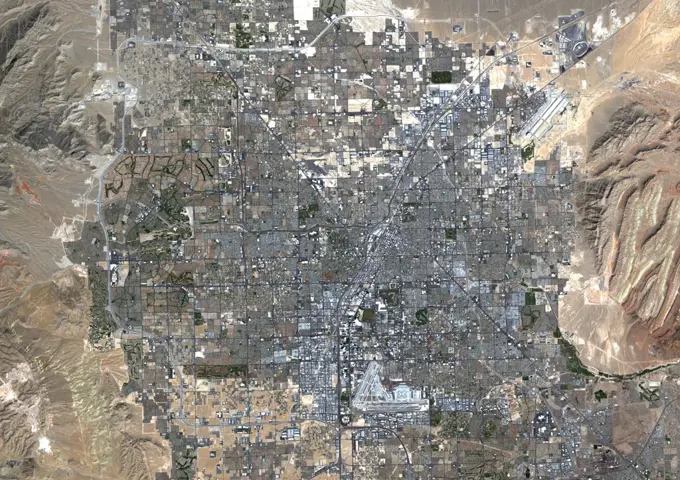
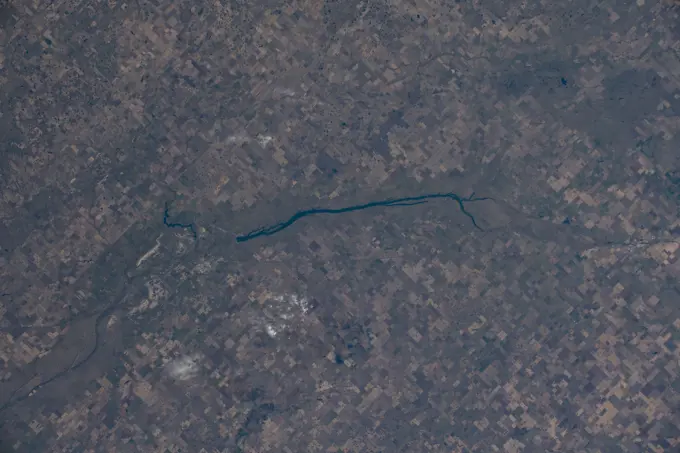
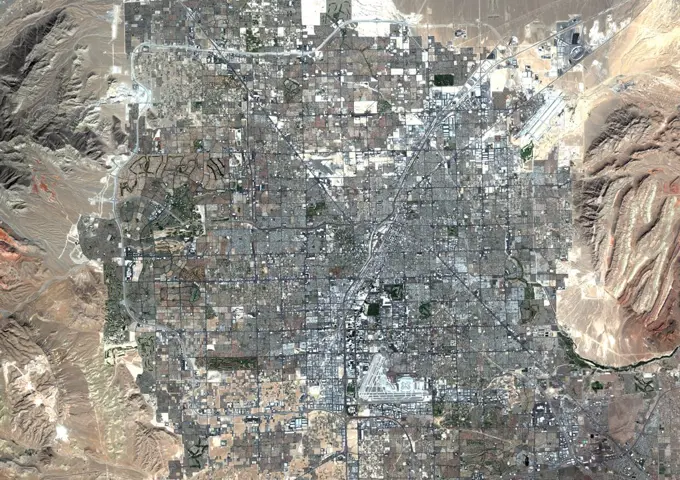
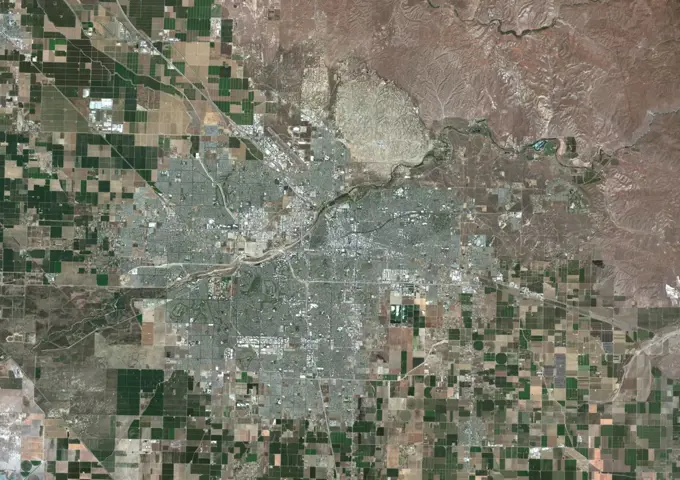
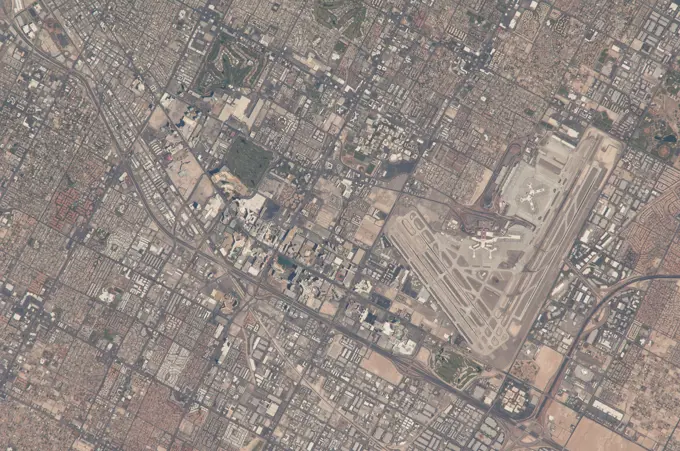
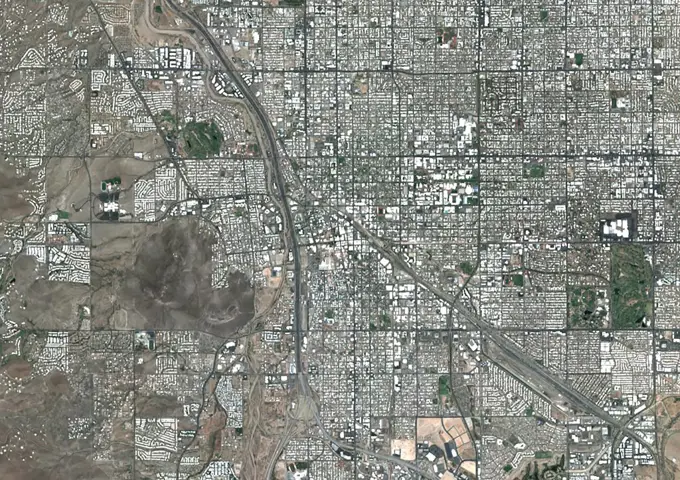
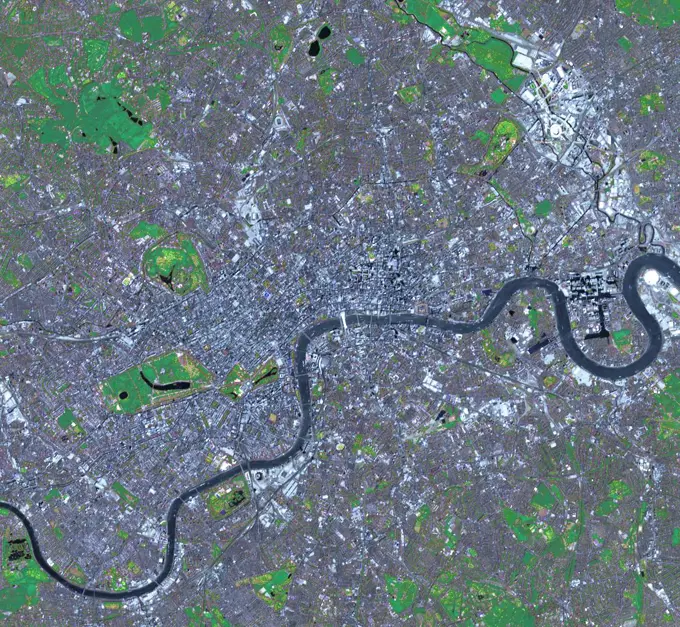
Satellite Imagery of Landscapes

High-resolution satellite images of diverse geological features, including urban areas and natural formations, showcasing Earth’s surface.

Colour satellite image of Cairo, Egypt. Image taken on December 16, 2013 with Landsat 8 data.
iss064e029481 (Feb. 8, 2021) --- An icy, snow-covered northeast Moscow is pictured from the International Space Station as it orbited 264 miles above Russia.This image from NASA's Terra spacecraft shows the Vatican City State, a sovereign city-state, whose area is a 44 hectare walled enclave west of the Tiber River, within the city of Rome.Burkina Faso, Africa, True Colour Satellite Image With Border. Satellite view of Burkina Faso (with border). This image was compiled from data acquired by LANDSAT 5 & 7 satellites.An 8-kilometer (5-mile) wide crater of possible impact origin is shown in this view of an isolated part of the Bolivian Amazon from NASA's Shuttle Radar Topography Mission.Satellite view of Agriculture in the Desert in Tabuk Region, Saudi Arabia in 1990 and 2001. This before and after image shows the expansion of circular agricultural plots over the years. Color satellite image of Minneapolis, Minnesota, United States. The Mississippi River flows through the city. MinneapolisSaint Paul International Airport is at south. Image collected on November 18, 2017 by Sentinel-2 satellites.This image, acquired by NASA's Terra satellite on July 29, 2001 shows a sulfur dioxide plume (in purple) drifting over the city of Catania.Earth Observations taken by Expedition 34 crewmember.Satellite view of the State of Alabama, United States. This image was compiled from data acquired by LANDSAT 5 & 7 satellites.Color satellite image of Togo, with mask.Satellite view of Cairo, Egypt in 1972 and 2013. This before and after image shows urban expansion over the years. SL4-93-167 (February 1974) --- A vertical view of the Kennedy Space Center and the Florida Atlantic coast area is seen in this Skylab 4 Earth Resources Experiments Package S190-B (five-inch earth terrain camera) infrared photography taken from the Skylab space station in Earth orbit. This photograph shows the major land-ocean features of the Florida coast near Vero Beach northward to Cape Canaveral and the KSC complex. The launch pads for the Skylab missions are clearly visible. Identification of living vegetation is possible through the use of the color infrared film. Various shades of red portray differences in the vegetation such as shown in the patterns in the agricultural area near Vero Beach. In the Kennedy Space Center, the nearly continuous and uniform red color shows that most of the land areas are heavily vegetated. The white coastal beach areas are strongly contrasted to the red land and the blue Atlantic Ocean. Old dunal areas in KSC are visible on Merritt Island which is sEarth Observations taken by Expedition 34 crewmember.Urban Expansion, Chengdu, Sichuan, China, True Colour Satellite Image. True colour satellite image of City of Chengdu, showing urban expansion in 1992 and 2000. The image used data from LANDSAT 7 satellite.Agriculture, Manitoba State, Canada, True Colour Satellite Image. True colour satellite image of cultivated fields in Manitoba State Around the Red River (in pink) and the mining city of Winnipeg (in grey). Image taken on 31 August 1991 using LANDSAT data.Manaus, Brazil, True Colour Satellite Image. Manaus, Brazil. True colour satellite image of the city of Manaus. Composite of 2 images taken on 4 & 11 August 2001, using LANDSAT 7 data.Earth observation taken by the Expedition 39 crew aboard the ISS. Image downlinked in folder Montreal, Canada etc., and released by astronaut on Twitter.Retreat of Alaskas Columbia Glacier; Satellite image shows the state of glacier melting in 1997Satellite view of the district of Castelo Branco, Portugal. This image was compiled from data acquired by LANDSAT 5 & 7 satellites.Satellite view of the State of Dadra and Nagar Haveli, India. This image was compiled from data acquired by LANDSAT 5 & 7 satellites.Ile Rouleau Meteor Impact Crater, Canada, True Colour Satellite Image. True colour satellite image of Ile Rouleau impact structure, Canada (age : 300 million years ; diameter : 4 km). Image taken on 25 September 1992 using LANDSAT data.'From the desert to the mountains to the sea,' this image acquired by NASA's Shuttle Radar Topography Mission (SRTM) in Feb. 2000, shows in striking detail the varied topography of Southern California.Location, aerial landscape and map of Earth with satellite image, mountain and valley with city. Nature, background and top view with topography, country environment and geography with aerospaceSatellite view of the Sacramento metropolitan area for July 2000.  Vegetation appears green, water looks blue, and built up land is depicted as purple. Earth observation taken by the Expedition 35 crew aboard the ISS.Chiyli Meteor Impact Crater, Kazakhstan, True Colour Satellite Image. True colour satellite image of Chiyli impact structure, Kazakhstan (diameter : 5,5 km). Image taken on 23 May 1988 using LANDSAT data.The biggest merger yet between two black holes produced gravity waves that were detected by gravitational wave detection systems. This analysis is the latest to come out of the international LIGO-VIRGO collaboration, which operates three super-sensitive gravitational wave-detection systems in America and Europe (Information from BBC News, September 2). The systems consist of two interferometers at right angles to each other. The two American LIGO systems are located near Livingston, LA (left image) and near Hanford, WA (center image); the European VIRGO system is located near Pisa, Italy (right image). The three ASTER cutouts each cover an area of 6 by 6 km.iss063e070632(Aug. 14, 2020) --- Shasta Lake, a reservoir in northern California, is pictured from the International Space Station as it orbited above the western United States.Earth Observations taken by Expedition 34 crewmember.This image from NASA's Terra spacecraft shows the Indian Ocean coastline north of Phuket, Thailand is a major tourist destination that was in the path of the tsunami produced by a giant offshore earthquake on December 26, 2004.These images from NASA's Terra satellite were captured on May 31 and July 18, 2002 and show Russia's Saratov Oblast (province), located in the southeastern portion of the East-European plain, in the Lower Volga River Valley.iss064e009722 (Dec. 4, 2020) --- Tulsa, Oklahoma, split by the Arkansas River, was pictured from the International Space Station as it orbited 262 miles above.ISS015-E-09961 (29 May 2007) --- Rio Jurua in Brazil is featured in this image photographed by an Expedition 15 crewmember on the International Space Station. The center point of this image is about 8 degrees, 33.8 minutes south latitude and 72 degrees, 49.7 minutes west longitude. North is to the bottom of the image.Near Fort McMurray, Alberta, Canada, on the east bank of the Athabasca River, are found the Steepbank and Millennium open pit mines. These images were acquired by NASA's Terra satellite on September 22, 2000 and July 31, 2007.Retreat of Alaskas Columbia Glacier; Satellite image shows the state of glacier melting in 2011Earth observation taken by the Expedition 35 crew aboard the ISS.Color satellite image of Houston, Texas, United States. Image collected on May 11, 2020 by Sentinel-2 satellites.iss056e094592 (July 10, 2018) --- The city of Page, Ariz., the Colorado River and Glen Canyon Dam which forms Lake Powell are pictured as the International Space Station's orbital trek took it over the southwestern United States.Retreat of Alaskas Columbia Glacier; Satellite image shows the state of glacier melting in 2006The mountains and desert plateaus of northwest Colorado are shown in this anaglyph from the MISR instrument aboard NASA's Terra spacecraft. 3D glasses are necessary to view this image.In many parts of the world, wetlands are being converted to shrimp ponds in order to farm these crustaceans for food and sale. One example is on the west coast of Ecuador, south of Guayaquil. This image was acquired by NASA's Terra spacecraft.The Eiffel Tower and its shadow can be seen next to the Seine in the left middle of this image of Paris acquired by NASA's Terra satellite.Colour satellite image of Las Vegas, Nevada, USA. Image taken on September 23, 2014 with Landsat 8 data. ISS039-E-000663 (12 March 2014) --- As in the case of this picture, when an astronaut in space uses an 800mm focal length, it is impossible to get the entire body of Houston, the nation's fourth most populous city, in one frame.  This photo was taken by one of the Expedition 39 crew members from the International Space Station on March 12, 2014.The large lens and the clear spring like weather provide a better than usual aerial study of the city. The downtown business district is in the center of the frame. The Relaint Stadium complex, home to the Houston Livestock and Rodeo, currently in progress, can be seen in the upper right portion of the photo.Between 1985 and 2009, the population of Tehran, Iran, grew from six million to just over seven million. The city's growth was spurred largely by migration from other parts of the country. In addition to being the hub of government and associated public sector jobs, Tehran houses more than half of Iran's industry. Landsat 5 acquired these false-color images of Tehran on August 2, 1985, and July 19, 2009. The city is a web of dark purple lines, vegetation is green and bare ground is pink and tan. The images were created using both infrared and visible light (band combination 7, 4, and 2) to distinguish urban areas from the surrounding desert. ---- NASA and the U.S. Department of the Interior through the U.S. Geological Survey (USGS) jointly manage Landsat, and the USGS preserves a 40-year archive of Landsat images that is freely available over the Internet. The next Landsat satellite, now known as the Landsat Data Continuity Mission (LDCM) and later to be called Landsat 8, is scheduled These two gray-scale images from NASA's Space Shuttle show part of the Nile River, near the Fourth Cataract in Sudan.iss061e006776 (Oct. 16, 2019) --- McDonald Lake in Saskatchewan, Canada, is pictured as the International Space Station orbited 254 miles above North America. The coal-mining city of Estevan, at the lake's southeast end surrounded by prairies and farms, is 10 miles north of the United States border of North Dakota.Color satellite image of Las Vegas, Nevada, United States. Image collected on October 08, 2017 by Sentinel-2 satellites.Color satellite image of Bakersfield, California, United States. Image collected on June 10, 2020 by Sentinel-2 satellites.Earth observation taken during a day pass by the Expedition 40 crew aboard the International Space Station (ISS).Color satellite image of Houston, Texas, United States. Image collected on September 11, 2017 by Sentinel-2 satellites.West Hawk Lake Meteor Impact Crater, Manitoba, Canada, True Colour Satellite Image. True colour satellite image of West Hawk Lake impact structure, Manitoba, Canada (diameter : 3,15 km). Image taken on 30 August 1990 using LANDSAT data.NASA's Terra spacecraft views central South Dakota, where the Missouri River forms a meander bend, creating Lake Sharpe. Eventually, the Missouri River will cut through the skinny peninsula, creating a shorter path.Siljan Meteor Impact Crater, Sweden, True Colour Satellite Image. True colour satellite image of Siljan impact structure, Sweden (diameter : 55 km). Image using LANDSAT data.Satellite view of Beijing, China in 1978 and 2013. This before and after image shows urban expansion over the years. This image pair from NASA's Terra spacecraft includes the area around the damaged Fukushima Dai-ichi nuclear power facility and extends northward along the coast.Colour satellite image of Houston, Texas, USA. Image taken on May 16, 2014 with Landsat 8 data. This is a radar image of San Francisco, California, taken on October 3,1994. The image is about 40 kilometers by 55 kilometers (25 miles by 34 miles) with north toward the upper right.ISS040-E-104966 (23 Aug. 2014) --- One of the Expedition 40 crew members aboard the International Space Station used an 800mm focal length to photograph this detailed image featuring a nadir view of the Las Vegas Strip and McCarron International Airport on Aug. 23, 2014.Color satellite image of the shrinking of the Aral Sea in 1990, 2000, 2010 and 2020.ISS026-E-017057 (9 Jan. 2011) --- From approximately 220 miles above Earth, one of the Expedition 26 crew members aboard the International Space Station took this wintry picture of metropolitan New York City, which was getting ready for its third heavy storm of the season.  The crew member used a 180-mm focal length on a digital still camera to record the image.ISS003-E-5737 (14 September 2001) --- One of the Expedition Three crew members aboard the International Space Station (ISS) used a 400mm lens (with an extender to achieve an 800mm effect) to record this digital still camera's nadir view of Greater New Orleans.  The French Quarter and the Superdome are left and just above the center point in the frame.NASA's Ecosystem Spaceborne Thermal Radiometer Experiment on Space Station (ECOSTRESS) instrument recorded this image of ground surface temperatures in London and surrounding areas on July 15, 2022, just before midnight local time. It shows surface temperatures exceeding 68 degrees Fahrenheit (20 degrees Celsius) at 11 57 p.m. British Summer Time. Parts of Europe in mid-July experienced a record-breaking heat wave. The United Kingdom reaching its highest air temperature on record on July 19, 104.5 F (40.3 C) in Coningsby, about 110 miles (177 kilometers) north of London, which itself saw a high of 104.3 F (40.2 C) the same day. That evening, the overnight low was also a record-breaker 78.4 F (25.8 C) at Kenley Airfield in Greater London. In this image, the red areas indicate hotter temperatures commonly associated with developed areas. These surfaces - roofs, paved streets, and other built structures - remain warm long after the sun sets. Blue and green areas indicate cooler areas commRelief map of the State of Mississippi, United States. This image was compiled from data acquired by LANDSAT 5 & 7 satellites combined with elevation data.Color satellite image of Tucson, Arizona, United States. Image collected on June 23, 2020 by Sentinel-2 satellites.NASA data and expertise are providing valuable information for the ongoing response to the Aug. 24, 2016, magnitude 6.2 Central Italy earthquake. The quake has caused significant damage in the historic town of Amatrice.NASA's ARIA team, in collaboration with the Earth Observatory of Singapore, used satellite data to map the extent of likely damage following a massive explosion in Beirut. Dark red pixels represent the most severe damage. Areas in orange are moderately damaged, and areas in yellow are likely to have sustained somewhat less damage. Each colored pixel represents an area of 30 meters (33 yards).This simulated natural color image of London was acquired May 26, 2012 by NASA's Terra spacecraft. Major construction projects included the new 400-acre Olympic Park for the 2012 Summer Olympic Games.The Advanced Rapid Imaging and Analysis (ARIA) team at NASA's Jet Propulsion Laboratory in Pasadena, California, and Caltech, also in Pasadena, created this Damage Proxy Map (DPM) depicting areas of Central Mexico, including Mexico City, that are likely damaged (shown by red and yellow pixels) from the magnitude 7.1 Raboso earthquake of Sept. 19, 2017 (local time). The map is derived from synthetic aperture radar (SAR) images from the Copernicus Sentinel-1A and Sentinel-1B satellites, operated by the European Space Agency (ESA). The images were taken before (Sept. 8, 2017) and after (Sept. 20, 2017) the earthquake. The map covers an area of 109 by 106 miles (175 by 170 kilometers). Each pixel measures about 33 yards (30 meters) across. The color variation from yellow to red indicates increasingly more significant ground and building surface change. Preliminary validation was done by comparing the DPM to a crowd-sourced Google Map (On June 10, 2022, Las Vegas reached a record daily high temperature of 109 degrees Fahrenheit (43 degrees Celsius), and temperatures on the ground itself were higher still. NASA's Ecosystem Spaceborne Thermal Radiometer Experiment on Space Station (ECOSTRESS) instrument recorded this image of ground surface temperatures at 5 23 p.m. that day. Within the city, the hottest surfaces were the streets - the grid of dark red lines in the center of the image. Pavement temperatures exceeded 122 F (50 C), while the exteriors of downtown buildings were a few degrees cooler than paved surfaces. Suburban neighborhoods averaged about 14 F (8 C) cooler than pavement, and green spaces such as golf courses were 23 F (13 C) cooler. Cities are usually warmer than open land because of human activities and the materials used for building. Streets are often the hottest part of the built environment due to asphalt paving. Dark-colored surfaces absorb more heat from the Sun than lighter-colored ones; asphaltThis image shows NASA's OCO-2 measurements of carbon dioxide levels over Pasadena and the northern Los Angeles basin on Sept. 5, 2014. Each colored dot represents a single measurement of the greenhouse gas made during an overflight of the area.The Advanced Rapid Imaging and Analysis (ARIA) team at NASA's Jet Propulsion Laboratory in Pasadena, California, and Caltech, also in Pasadena, created a Damage Proxy Map (DPM) depicting areas in Southern California that are likely damaged (shown by red and yellow pixels) as a result of recent wildfires, including the Thomas Fire in Ventura and Santa Barbara Counties, highlighted in the attached image taken from the DPM. The map is derived from synthetic aperture radar (SAR) images from the Copernicus Sentinel-1 satellites, operated by the European Space Agency (ESA). The images were taken before (Nov. 28, 2017, 6 a.m. PST) and after (Dec. 10, 2017, 6 a.m. PST) the onset of the fires. The map covers an area of 107 by 107 miles (172 by 172 kilometers), shown by the large red polygon. Each pixel measures about 33 yards (30 meters) across. The color variation from yellow to red indicates increasingly more significant ground surface change. Preliminary validation was done by comparing the The Advanced Rapid Imaging and Analysis (ARIA) team at NASA's Jet Propulsion Laboratory in Pasadena, California, created these Damage Proxy Maps (DPMs) depicting areas in California likely damaged by the Woolsey and Camp Fires. They are derived from synthetic aperture radar (SAR) images from the Copernicus Sentinel-1 satellites, operated by the European Space Agency (ESA). The pre-event images for the Woolsey Fire in Southern California were taken before the fire on Oct. 30, 2018 and the post-event image was acquired during the fire on Nov. 11, 2018. The map covers an area of 50 miles x 25 miles (80 km x 40 km), indicated with the big red polygon. Each pixel measures about 33 yards x 33 yards (30 m x 30 m). The color variation from yellow to red indicates increasingly more significant ground surface change. The pre-event images for the Camp Fire in Northern California were taken on Nov. 4, 2018 and the post-event images were acquired during the fire on Nov. 10, 2018. The map covers an