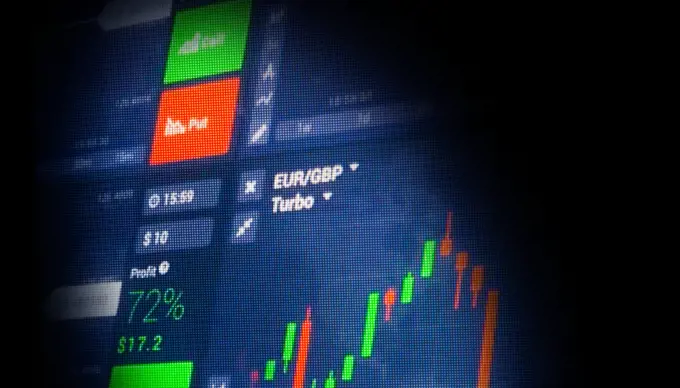
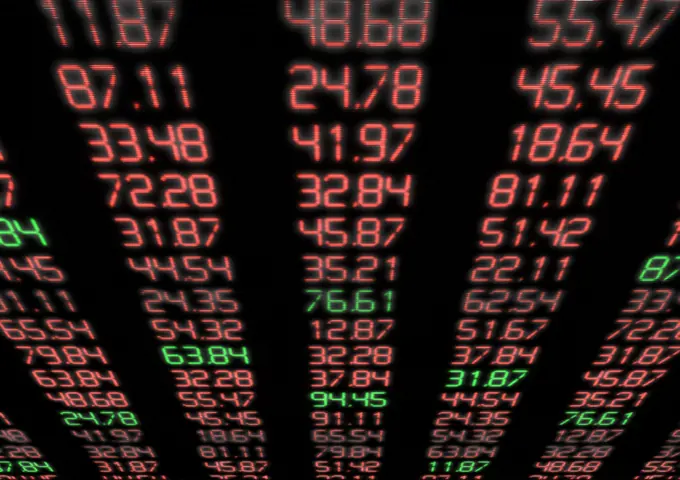
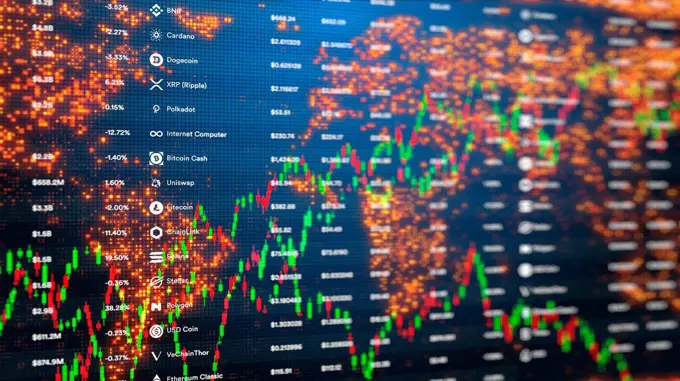
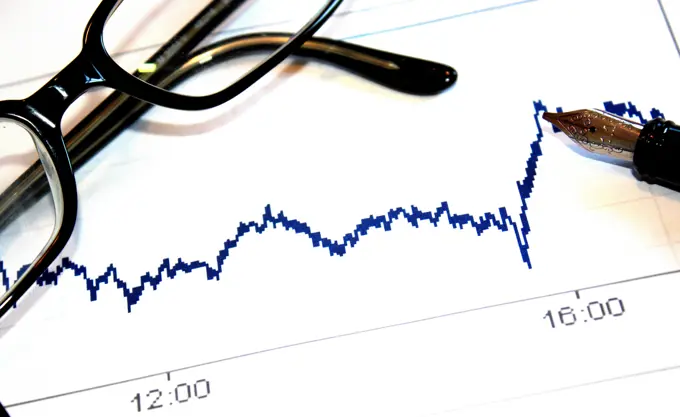
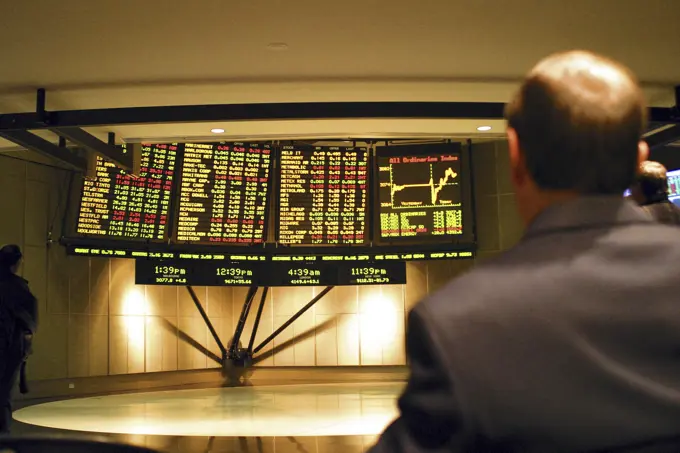
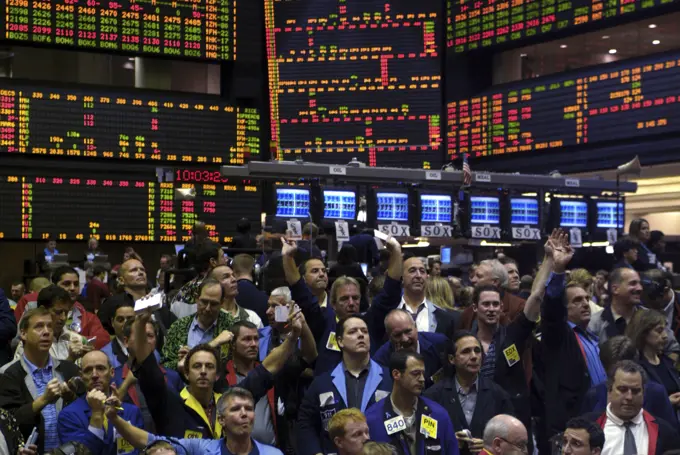
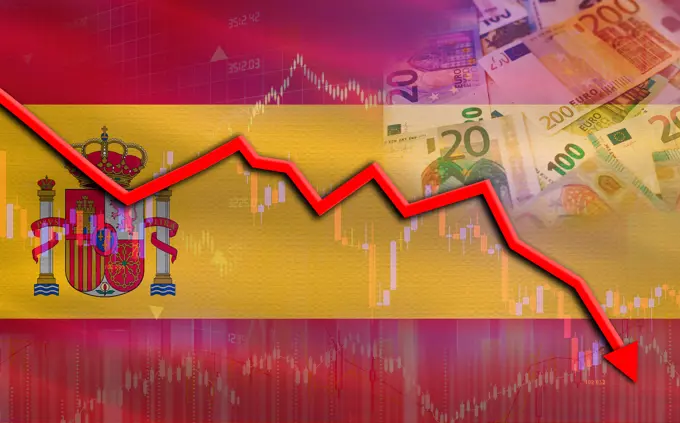
Stock Market VisualizationsGraphical representations of stock prices, financial data, and investment trends in a digital context, showcasing market analysis. stock market graph on big lcd display closeup macro 183 assets in this story1849-662132386188-600106994197-667039371525-563120611525-248731901525-268813671525-272302301525-239116731525-230395341525-217615101525-565290491525-247201991525-232374576188-555754891525-265362711525-565771491439-607944691525-268875901525-268526771525-568633351525-236857611525-274596281525-569061661525-252583481525-283913311525-562217546188-651734411525-236273971525-234836541525-244708221525-231627841525-282944901525-254491531525-217594051525-230372311525-564337741525-224387951525-231628671525R-419601525-252348921525-563496714197-677627891525-231623171815-157607564128-202439751525-283827791525-567946451525-564717721525-569057551525-563843231525-24628963882-10664197-677628011525-252604031525-272450571525-228446901525-252839205507-413762616188-556367501525-236693086188-665618091525-570032241848-553137301525-257386711525-205939621525-562287035507-311471116188-633445681525-664240335507-644281061841R-1251681525-256113051525-283358675507-486382165507-344197651525-283359641525-228453091525-252560735507-636488271525-235869911525-570791301525-232820501525-561923185507-465509201525-241438715507-396581011525-198744571525R-1255941525-216482321890-241181525R-1255845507-464394831815R-110966857110-703652095507-341310846188-665618441525-283359631525-204009297110-703652241525-75947684 PREVIOUS of 2 NEXT