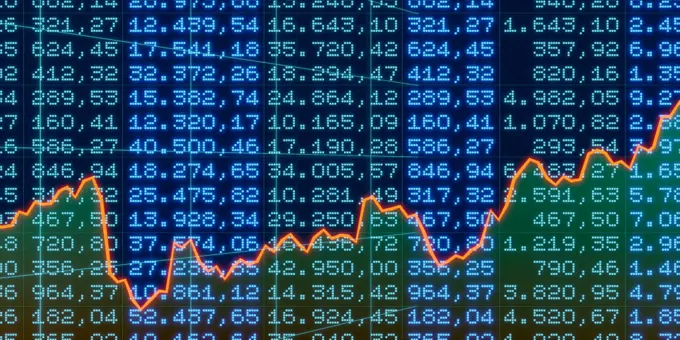
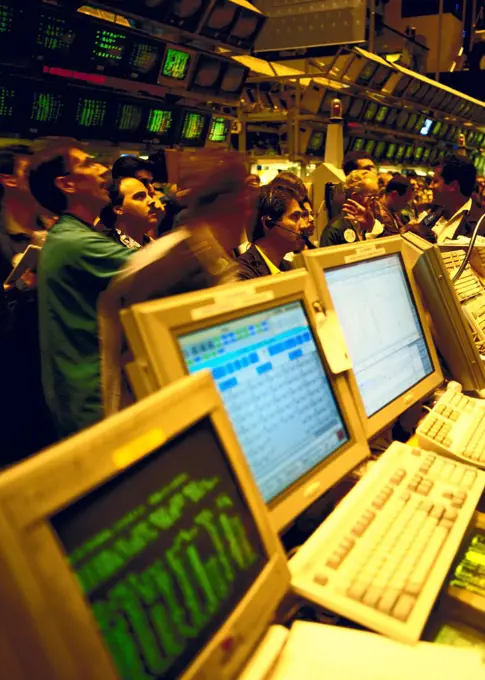
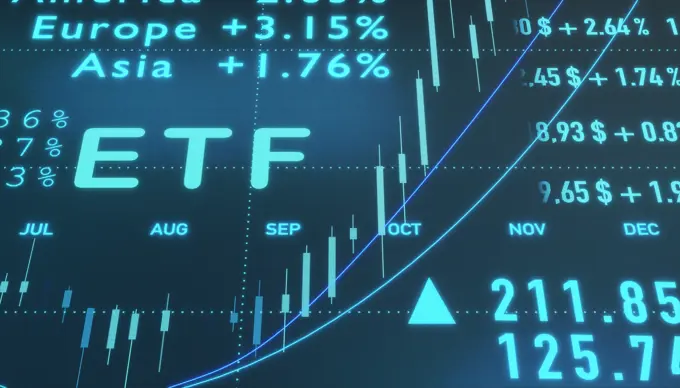
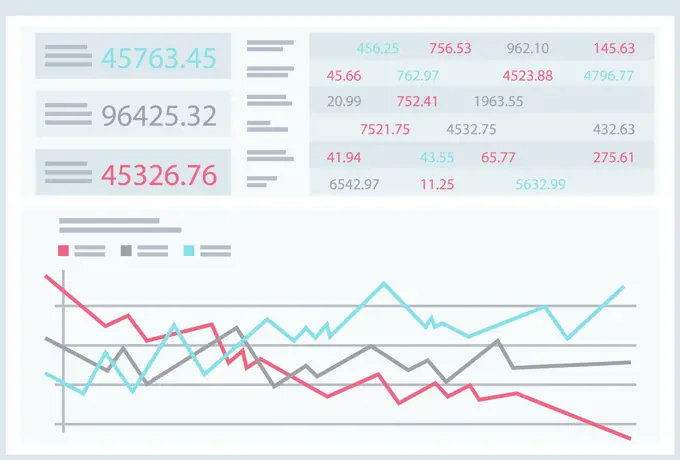
Stock Market VisualizationsGraphical representations of stock prices, financial data, and investment trends in a digital context, showcasing market analysis. stock market graph on big lcd display closeup macro 183 assets in this story1525R-1255801525-574472051525-279588341850-321746188-539069746188-639340491589R-804811525-209348961599R-178331841R-1251631848-532392186188-556177251848-552530551525-209125541848-601616321525-270749571525-275430841570R-1287961558-141621437112-702878561525-198680631525-228680061525-235571831501R-5695514-676191286188-639778266188-600106156176-601645926188-665617926188-600100097110-703652051525-236288711599R-252621525-207481566188-600106145507-378796887110-703651956188-623642167110-703651966188-600088861525-254795116188-609427531525-254793776188-556507031525-265317501525-282458221525-252620916188-676678711849-662096225507-394699401525-278127561525-217601021525-663834171525-255903475507-458280501525-206243746188-681019091849-662197961525-229816681525-267109656188-639577945507-476922311525-203545716188-639769851525-198676071525-268270781848-508117765507-426727021525-262684331525-253066894306R-228345507-457295055507-437718666188-600091481525-245138701848-648678991525-273277891848-599822241525-245497121525-239794235507-472439181746-196617231525-26804719 PREVIOUS of 2 NEXT